


图例配置
- shape, color, size 这三个图形属性如果判断接收的参数是数据源的字段时,会自动生成不同的图例;
- shape属性,会根据不同的 shape 类型生成图例;
- color 属性,会赋予不同的图例项不同的颜色来区分图形;
- size属性,在图例上显示图形的大小。
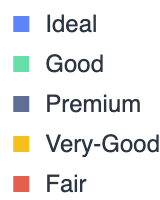
图例类型
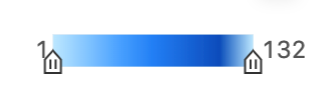
G2 中图例分为连续图例和分类图例两种,由于这两种图例的结构不同,所以配置项也存在差异。
分类图例
连续图例
图例同坐标轴一样,其内容也是由 scale 度量控制的,而渲染的细节,则是由主题控制,G2 同样开放了 chart.legend() 接口供用户进行个性化配置。
隐藏图例、更改图例位置
chart.legend(false); // 关闭全部图例
chart.legend('x',false);//只隐藏x维度对应的图例

//更改图例位置
chart.legend({
  position: 'right',
}); // 图例进行整体配置
//更改 x 维度对应的图例的显示位置
chart.legend('x',{
position:'bottom',
});
图形标注配置(annotation)
图表标注类型及语法
- arc:辅助弧线,只在极坐标系下生效。常用于绘制仪表盘。
chart.annotation().arc({});
- image:辅助图片,在图表上添加辅助图片。
chart.annotation().image({});
- line:辅助直线。
chart.annotation().line({});
- region:辅助框,框选一段图区,设置背景、边框等。
chart.annotation().region({});
- regionFilter:区域着色,将图表中位于矩形选区中的图形元素提取出来,重新着色。
chart.annotation().regionFilter({})
- dataMarker:特殊数据点标注,多用于折线图和面积图。
chart.annotation().dataMarker({})
- dataRegion:特殊数据区间标注,多用于折线图和面积图。
chart.annotation().dataRegion({})
清空图形标注
//清空所有的图形标注,但不会清空配置,当用户再次调用 chart.render() 时,所有的 annotation 会重新绘制。
chart.annotation().clear();

//清空所有图形标注,同时清空配置
chart.annotation().clear(true);
动态图形标注
G2 图形标注接受的位置信息的参数都是原始数据值,辅助标记一旦生成后就是固定了位置,如果数据是动态更新的那么这个过程需要频繁进行,辅助标记需要不断地删除重新创建,非常麻烦;基于这种场景 Annotation 提供了如下两种解决方案
- 使用 ‘min’, ‘median’, ‘max’ 关键字,代表原始值的最小值、平均值、最大值,例如: [0, ‘min’] 表示 x 轴上数值为 0,y 轴位置在数值的最小值上;
- 表示位置的数组可以换成回调函数,函数原型: function(xScale, yScales) {return [];}
玫瑰图代码片段
 const data=[];
	  //floor() 方法执行的是向下取整计算,它返回的是小于或等于函数参数,并且与之最接近的整数
	  const time=Math.floor(new Date().getTime()/1000)*1000;

	  for(let i=-19;i<=0;i++) {
	  	data.push({
	  		time:time+i*3*1000,

	  		//random() 方法可返回介于 0(包含) ~ 1(不包含) 之间的一个随机数
	  		value:Math.random()+0.25,
	  	});
	  }
	  // 查找最大值
function findMax() {
  let maxValue = 0;
  let maxObj = null;
  data.forEach((obj) => {
    if (obj.value > maxValue) {
      maxValue = obj.value;
      maxObj = obj;
    }
  });
  return maxObj;
}
const chart = new G2.Chart({
  // 创建图表
  container: 'c1',
  autoFit: false,
  width: 600,
  height: 450,
});
chart.data(data.concat([]));
chart.scale({
  time: {
    type: 'time',
    mask: 'HH:mm:ss',
  },
  value: {
    nice: true,
  },
});
chart.animate(false);
// chart.axis(false);//axis坐标样式配置
chart.legend(false); // 关闭全部图例
chart.coordinate('polar',{
	innerRadius:0.1,
})
chart.interval().position('time*value').color('value');

chart.annotation().text({
  position() {
    const obj = findMax();
    return [obj.time, obj.value];
  },
  content: '最大值',
});

chart.render();

setInterval(function() {
  data.shift();
  data.push({
    time: new Date().getTime(),
    value: Math.random() + 0.25,
  });
  chart.changeData(data.concat([]));
}, 3000);
文本标签配置
语法:
geometry.label();
文本标签类型: 分为’base’、‘interval’、‘pie’、‘polar’,4种类型。
树图为例
    fetch('https:/g2.antv.vision/zh/examples/data/flare.json')
      .then(res => res.json())
      .then(data => {
        const dv = new DataSet.View().source(data, {
          type: 'hierarchy'
        });
        dv.transform({
          type: 'hierarchy.tree'
        });

        const chart = new G2.Chart({
          container: 'container',
          autoFit: true,
          height: 500,
          padding: [50, 0, 20, 0]
        });
        chart.axis(false);
        chart.legend(false);
        chart.coordinate('polar');
        chart.scale({
          x: {
            nice: true,
            sync: true,
          },
          y: {
            nice: true,
            sync: true,
          },
        });

        const edgeView = chart.createView();
        edgeView.data(dv.getAllLinks().map(link => ({
          x: [link.source.x, link.target.x],
          y: [link.source.y, link.target.y],
          source: link.source.id,
          target: link.target.id
        })));
        edgeView.edge()
          .position('x*y')
          .shape('smooth') // vhv
          .color('grey')
          .tooltip('source*target')
          .style({
            strokeOpacity: 0.5,
          });

        const nodeView = chart.createView();
        nodeView.data(dv.getAllNodes().map(node => ({
          hasChildren: !!(node.data.children && node.data.children.length),
          name: node.data.name,
          value: node.value,
          depth: node.depth,
          x: node.x,
          y: node.y
        })));
        nodeView.point()
          .position('x*y')
          .color('hasChildren')
          .label('name', {
            offset: 0,
            labelEmit: true,
            style: {
              fill: 'grey',
              fontSize: 9,
            }
          });

        chart.render();
      });


 594
594


 被折叠的 条评论
为什么被折叠?
被折叠的 条评论
为什么被折叠?
 到【灌水乐园】发言


