


 本文介绍了如何修改Prometheus的部署文件以添加身份验证,包括创建新的ConfigMap存储基本身份验证信息,并在prometheus-promethues.yaml中配置config-reloader以处理配置更新,从而解决未认证和OOM问题。作者还提到了在Kubernetes中确保正确pod数量的方法以及查看日志确认配置更改的步骤。
修改promethues-prometheus.yaml部署文件
apiVersion: monitoring.coreos.com/v1
kind: Prometheus
metadata:
  labels:
    app.kubernetes.io/component: prometheus
    app.kubernetes.io/instance: k8s
    app.kubernetes.io/name: prometheus
    app.kubernetes.io/part-of: kube-prometheus
    app.kubernetes.io/version: 2.48.0
  name: k8s
  namespace: monitoring
spec:
  alerting:
    alertmanagers:
    - apiVersion: v2
      name: alertmanager-main
      namespace: monitoring
      port: web
  containers:
     - name: prometheus
       image: quay.io/prometheus/prometheus:v2.48.0
       args:
         - "--web.config.file=/etc/prometheus/web_config.yaml"
         - "--config.file=/etc/prometheus/config_out/prometheus.env.yaml"
         - "--web.enable-lifecycle"
       volumeMounts:
         - name: config-volume
           mountPath: /etc/prometheus/prometheus.yml
           subPath: prometheus.yml
           readOnly: true
         - name: web-config-map
           mountPath: /etc/prometheus/web_config.yaml
           subPath: web_config.yaml
           readOnly: true
       livenessProbe:
         httpGet:
           path: /-/healthy
           port: web
           scheme: HTTP
           httpHeaders:
             - name: Authorization
               value: Basic YWRtaW46YWRtaW4=
       readinessProbe:
         httpGet:
           path: /-/ready
           port: web
           scheme: HTTP
           httpHeaders:
             - name: Authorization
               value: Basic YWRtaW46YWRtaW4=
       startupProbe:
         httpGet:
           path: /-/ready
           port: web
           scheme: HTTP
           httpHeaders:
             - name: Authorization
               value: Basic YWRtaW46YWRtaW4= # 账号:密码 base64加密后的字符串
  enableFeatures: []
  externalLabels: {}
  nodeSelector:
    kubernetes.io/os: linux
  podMetadata:
    labels:
      app.kubernetes.io/component: prometheus
      app.kubernetes.io/instance: k8s
      app.kubernetes.io/name: prometheus
      app.kubernetes.io/part-of: kube-prometheus
      app.kubernetes.io/version: 2.48.0
  podMonitorNamespaceSelector: {}
  podMonitorSelector: {}
  probeNamespaceSelector: {}
  probeSelector: {}
  replicas: 2
  resources:
    requests:
      memory: 400Mi
  ruleNamespaceSelector: {}
  ruleSelector: {}
  scrapeConfigNamespaceSelector: {}
  scrapeConfigSelector: {}
  securityContext:
    fsGroup: 2000
    runAsNonRoot: true
    runAsUser: 1000
  serviceAccountName: prometheus-k8s
  serviceMonitorNamespaceSelector: {}
  serviceMonitorSelector: {}
  version: 2.48.0
  volumes:
    - name: config-volume
      configMap:
        name: prometheus-config # 挂载prometheus的配置文件
    - name: web-config-map
      configMap:
         name: web-config-map # 挂载身份密钥
新增configMap身份验证文件
apiVersion: v1
kind: ConfigMap
metadata:
  name: web-config-map
  namespace: monitoring
data:
  web_config.yaml: |
    basic_auth_users:
        "admin": "$2b$12$S5yuS3NL31zaKpCEoXiBXeAoBmduJgHUqiSu3c6QXxSfXGva1BdR6" # hash加密后的字符串,具体可看链接的password.py文件生成
新增promethues-config的configMap文件
apiVersion: v1
kind: ConfigMap
metadata:
  name: prometheus-config
  namespace: monitoring
data:
  prometheus.yml: >
    global:
      scrape_interval:     15s # Set the scrape interval to every 15 seconds. Default is every 1 minute.
      evaluation_interval: 15s # Evaluate rules every 15 seconds. The default is every 1 minute.

    # Alertmanager configuration

    alerting:
      alertmanagers:
        - static_configs:
            - targets:
              # - alertmanager:9093

    # Load rules once and periodically evaluate them according to the global

    rule_files:

    # - "first_rules.yml"

    # - "second_rules.yml"


    # A scrape configuration containing exactly one endpoint to scrape:

    # Here it's Prometheus itself.

    scrape_configs:
      # The job name is added as a label `job=<job_name>` to any timeseries scraped from this config.
      - job_name: 'prometheus'

        # metrics_path defaults to '/metrics'
        # scheme defaults to 'http'.

        static_configs:
          - targets: ['localhost:9090']
完成后部署文件,即可看到promethues需要校验的弹框

由于promethues采用了prometheus-config-reloader来热更新配置文件,会出现401未认证的问题,并导致pod会出现OOM错误,重启pod
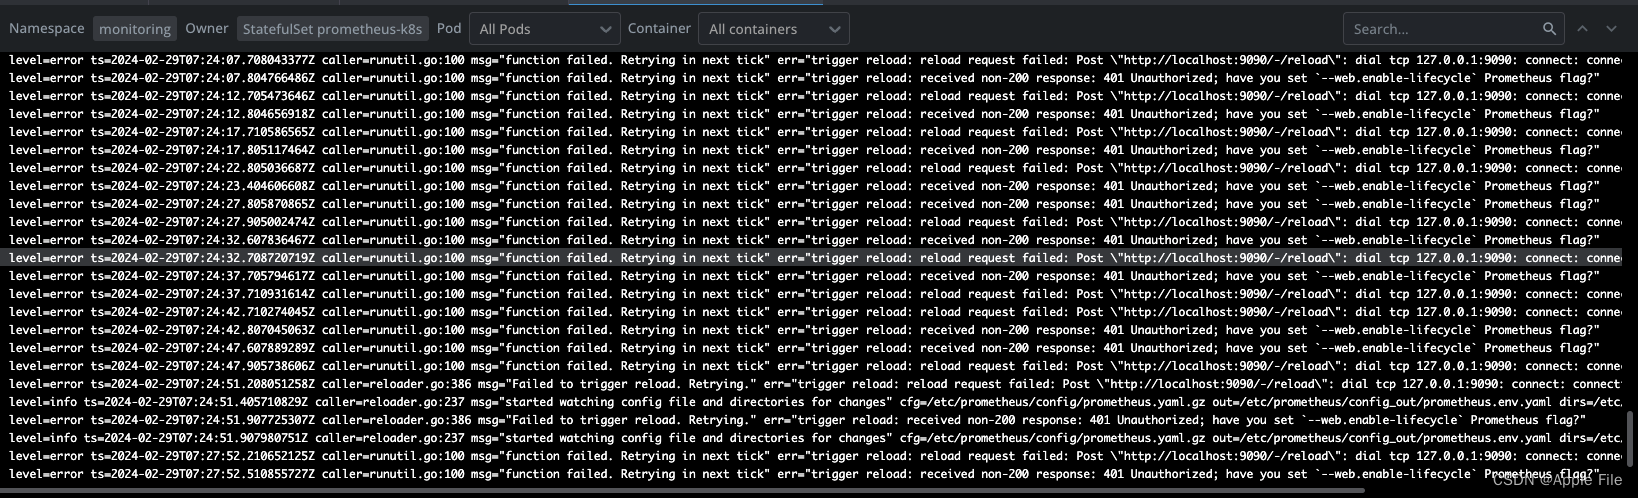
所以我们需要修改prometheus-promethues.yaml文件,覆盖prometheus-operator生成的默认配置
在promethues-prometheus.yaml中新增container:
- name: prometheus-config-reloader
       image: quay.io/prometheus-operator/prometheus-config-reloader:v0.69.1
       args:
         - '--listen-address=:8080'
         - '--reload-url=http://admin:admin@localhost:9090/-/reload'
         - '--config-file=/etc/prometheus/config/prometheus.yaml.gz'
         - '--config-envsubst-file=/etc/prometheus/config_out/prometheus.env.yaml'
       ports:
         - name: reloader-web
           containerPort: 8080
           protocol: TCP
       env:
         - name: POD_NAME
           valueFrom:
             fieldRef:
               apiVersion: v1
               fieldPath: metadata.name
         - name: SHARD
           value: '0'
       resources:
         limits:
           cpu: 100m
           memory: 50Mi
         requests:
           cpu: 100m
           memory: 50Mi
       volumeMounts:
         - name: config
           mountPath: /etc/prometheus/config
         - name: config-out
           mountPath: /etc/prometheus/config_out
         - name: prometheus-k8s-rulefiles-0
           mountPath: /etc/prometheus/rules/prometheus-k8s-rulefiles-0
重新部署
这里需要只能有3个pod,如果多了说明上面配置的name是不一样的,需要更改为一样的name

最后查看pod日志,不会出现401错误即可 本测试基于最新版本演示,具体代码可看GitHub - tjl-with-code/kube-prometheus: Use Prometheus to monitor Kubernetes and applications running on Kubernetes的main-auth分支!!


 692
692


 被折叠的 条评论
为什么被折叠?
被折叠的 条评论
为什么被折叠?
 到【灌水乐园】发言


