


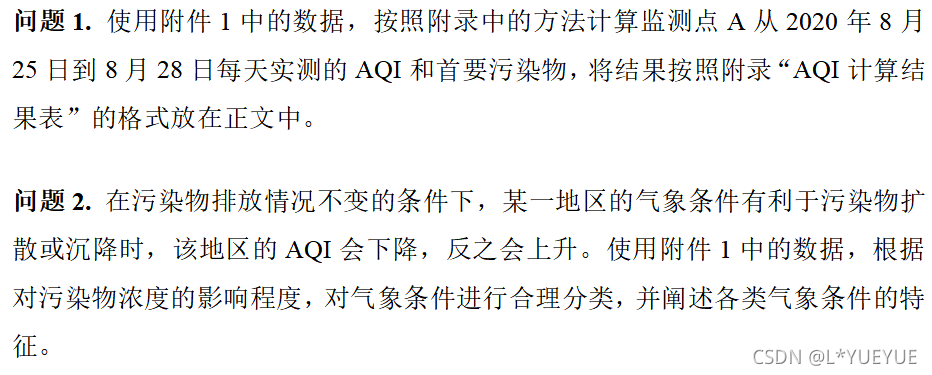
这周终于将数学建模弄完了,整个过程太煎熬了,题意不容易理解,代码运行不断报错,让人头大,不过幸亏还是坚持了下来。这次建模让我最有收获的是让我捡起了我之前学的python,之前接触python就是学习它的框架,没有接触过它的数据处理模块,这次建模下来,让我觉得使用python处理数据真的太方便了!
一开始我们选择的是B题,需要对很多excel表进行处理并分析,做到第三问没有思路就改做D题了。
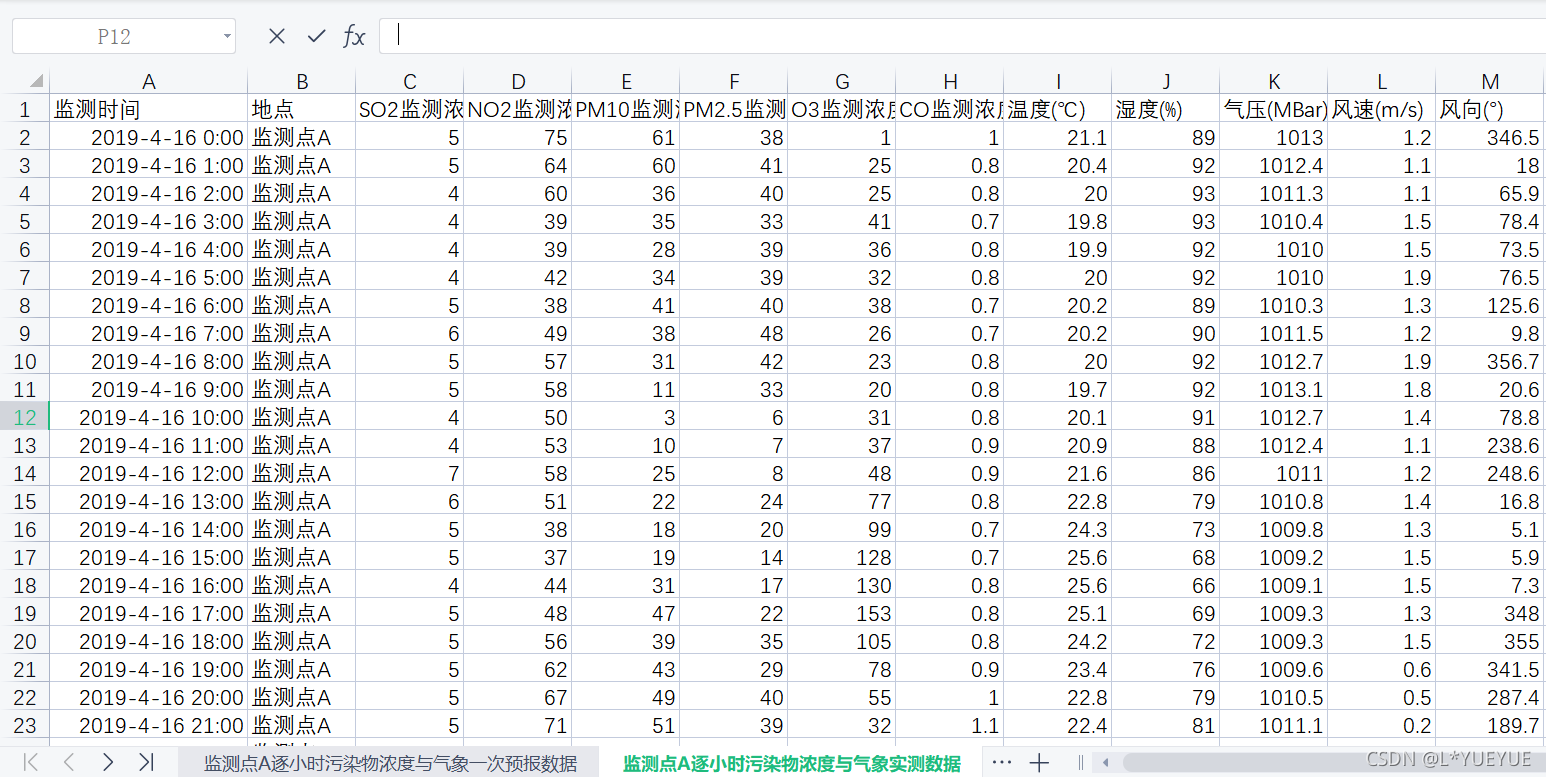
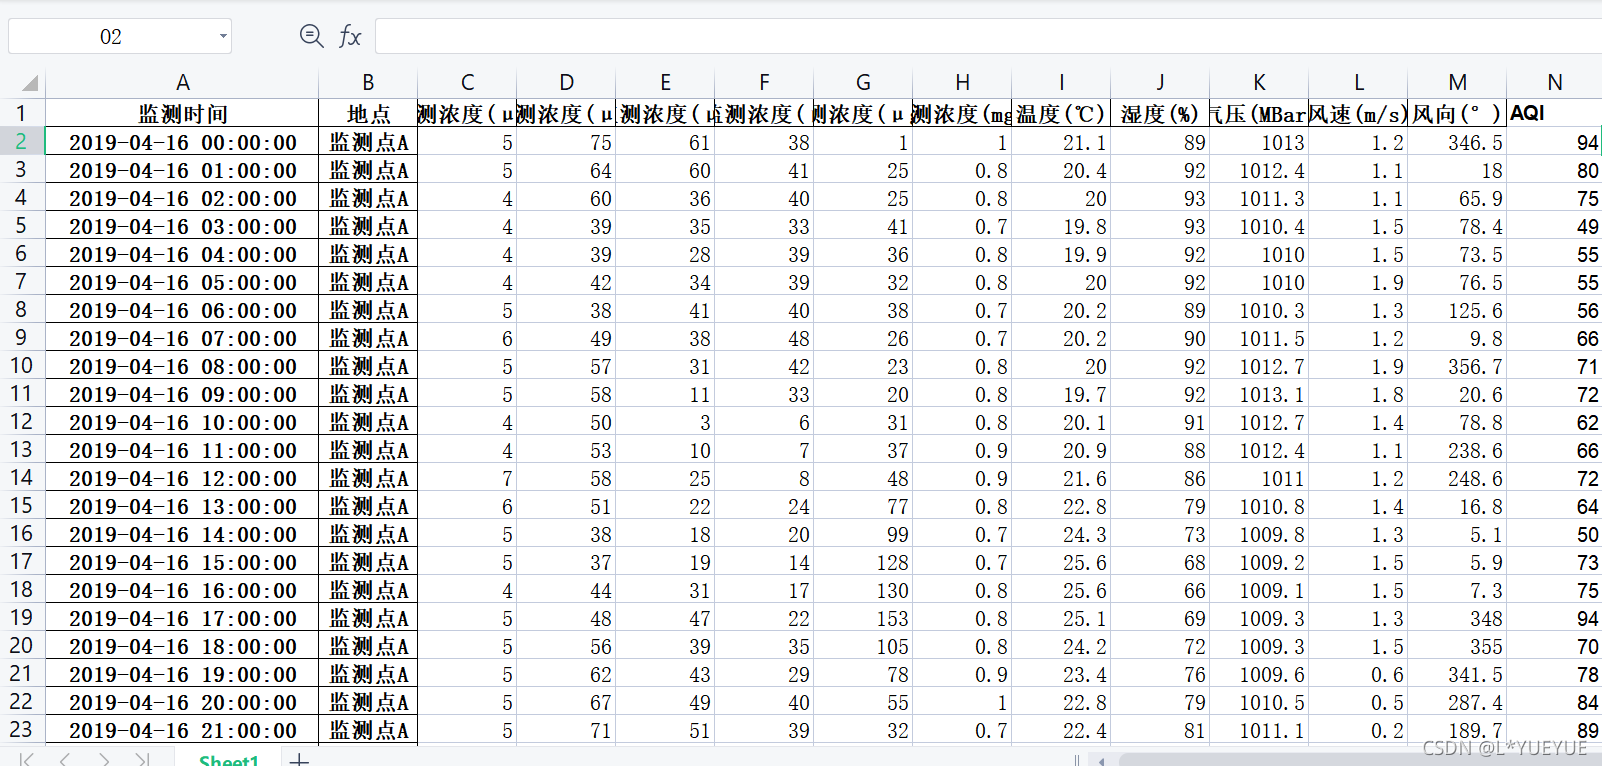
针对问题一:其实使用到的是附件一的下列数据
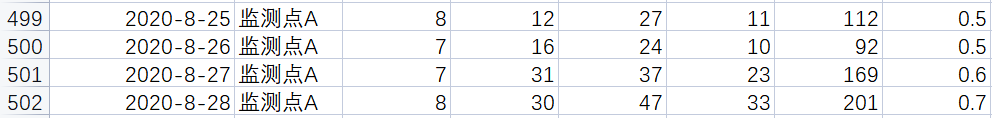
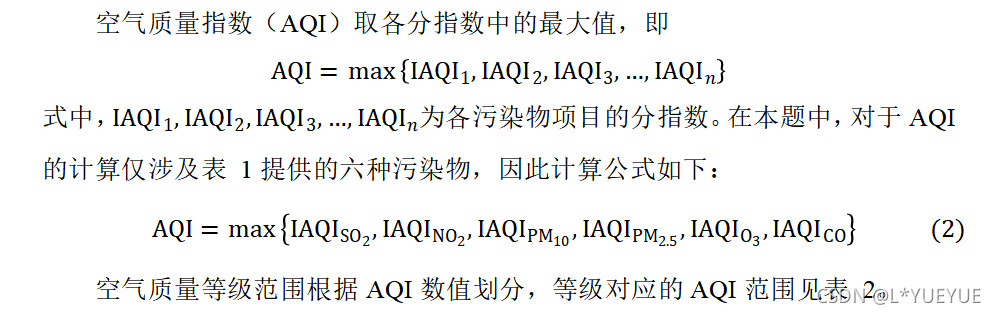
根据题意如下图,我们知道要算出AQI,需要先算出IAQI
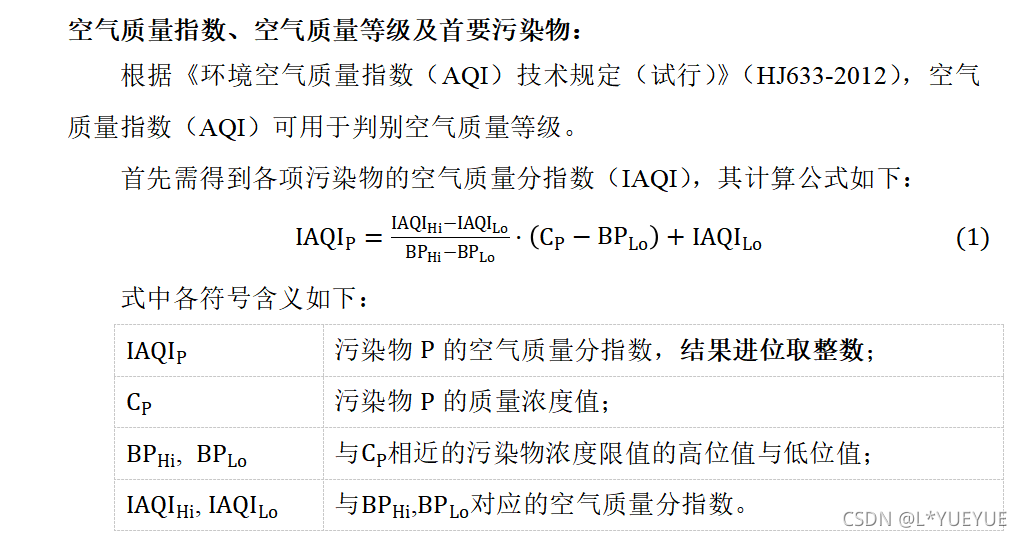
AQI和IAQI的关系为:
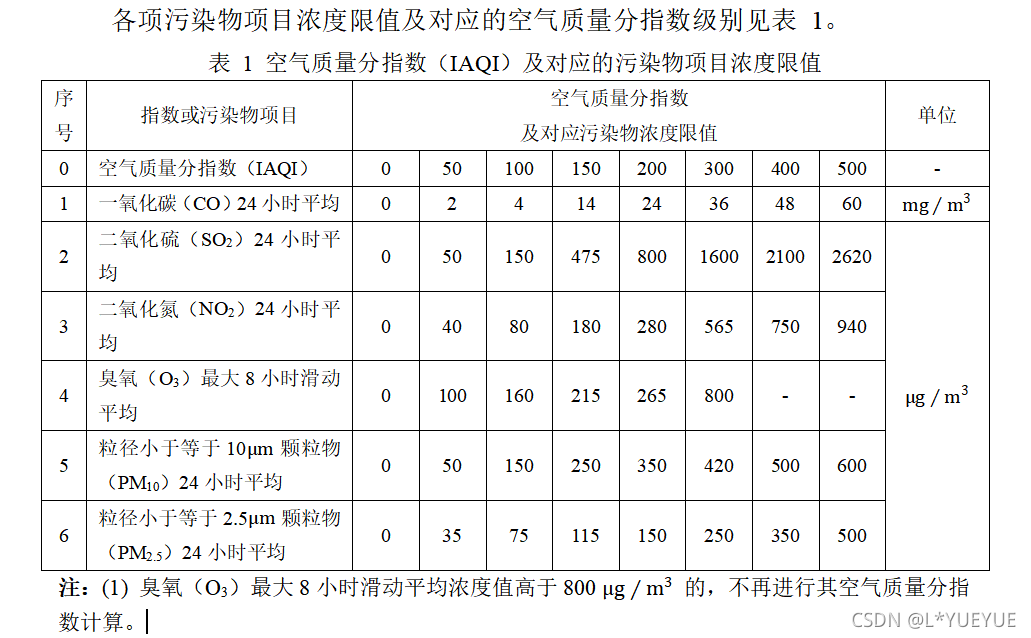
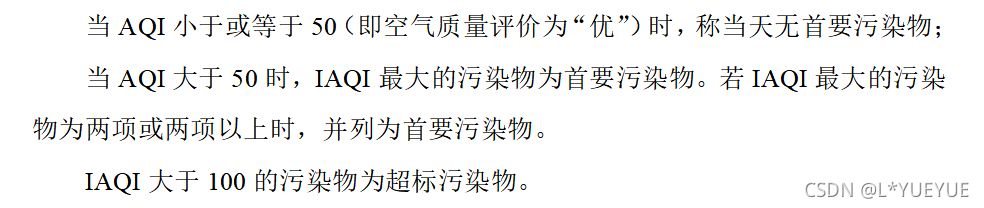
AQI和首要污染物的关系如下图,所以我们输出各种污染物的IAQI时,还要知道哪个污染物的IAQI最大。
python代码如下:
first1.py
def cal_linear(iaqi_lo, iaqi_hi, bp_lo, bp_hi, cp):
    iaqi = (iaqi_hi - iaqi_lo) * (cp - bp_lo) / (bp_hi - bp_lo) +iaqi_lo
    return round(iaqi)

def cal_co_iaqi(co_val):
    # 计算co的IAQI
    if 0 <= co_val < 3000:
        iaqi = cal_linear(0, 50, 0, 3000, co_val)
    elif 3000 <= co_val < 5000:
        iaqi = cal_linear(50, 100, 3000, 4000, co_val)
    elif 5000 <= co_val < 15000:
        iaqi = cal_linear(100, 150, 4000, 14000, co_val)
    elif 15000 <= co_val < 25000:
        iaqi = cal_linear(150, 200, 14000, 24000, co_val)
    elif 25000 <= co_val < 37000:
        iaqi = cal_linear(200, 300, 24000, 36000, co_val)
    elif 37000 <= co_val < 49000:
        iaqi = cal_linear(300, 400, 36000, 48000, co_val)
    elif 49000 <= co_val < 61000:
        iaqi = cal_linear(400, 500, 48000, 60000, co_val)
    else:
        pass
    return (iaqi)

def cal_so2_iaqi(so2_val):
    # 计算so2的IAQI
    if 0 <= so2_val < 51:
        iaqi = cal_linear(0, 50, 0, 50, so2_val)
    elif 51 <= so2_val < 151:
        iaqi = cal_linear(50, 100, 50, 150, so2_val)
    elif 151 <= so2_val < 476:
        iaqi = cal_linear(100, 150, 150, 475, so2_val)
    elif 476 <= so2_val < 801:
        iaqi = cal_linear(150, 200, 475, 800, so2_val)
    elif 801 <= so2_val < 1601:
        iaqi = cal_linear(200, 300, 800, 1600, so2_val)
    elif 1601 <= so2_val < 2101:
        iaqi = cal_linear(300, 400, 1600, 2100, so2_val)
    elif 2101 <= so2_val < 2621:
        iaqi = cal_linear(400, 500, 2100, 2620, so2_val)
    else:
        pass
    return (iaqi)

def cal_no2_iaqi(no2_val):
    # 计算no2的IAQI
    if 0 <= no2_val < 41:
        iaqi = cal_linear(0, 50, 0, 40, no2_val)
    elif 41 <= no2_val < 81:
        iaqi = cal_linear(50, 100, 40, 80, no2_val)
    elif 81 <= no2_val < 181:
        iaqi = cal_linear(100, 150, 80, 180, no2_val)
    elif 181 <= no2_val < 281:
        iaqi = cal_linear(150, 200, 180, 280, no2_val)
    elif 281 <= no2_val < 566:
        iaqi = cal_linear(200, 300, 280, 565, no2_val)
    elif 566 <= no2_val < 751:
        iaqi = cal_linear(300, 400, 565, 750, no2_val)
    elif 751 <= no2_val < 941:
        iaqi = cal_linear(400, 500, 750, 940, no2_val)
    else:
        pass
    return (iaqi)

def cal_o3_iaqi(o3_val):
    # 计算o3的IAQI
    if 0 <= o3_val < 101:
        iaqi = cal_linear(0, 50, 0, 100, o3_val)
    elif 101 <= o3_val < 161:
        iaqi = cal_linear(50, 100, 100, 160, o3_val)
    elif 161 <= o3_val < 216:
        iaqi = cal_linear(100, 150, 160, 215, o3_val)
    elif 216 <= o3_val < 266:
        iaqi = cal_linear(150, 200, 215, 265, o3_val)
    elif 266 <= o3_val < 801:
        iaqi = cal_linear(200, 300, 265, 800, o3_val)
    else:
        pass
    return (iaqi)

def cal_pm10_iaqi(pm10_val):
    # 计算PM10的IAQI
    if 0 <= pm10_val < 51:
        iaqi = cal_linear(0, 50, 0, 50, pm10_val)
    elif 51 <= pm10_val < 151:
        iaqi = cal_linear(50, 100, 50, 150, pm10_val)
    elif 151 <= pm10_val < 251:
        iaqi = cal_linear(100, 150, 150, 250, pm10_val)
    elif 251 <= pm10_val < 351:
        iaqi = cal_linear(150, 200, 250, 350, pm10_val)
    elif 351 <= pm10_val < 421:
        iaqi = cal_linear(200, 300, 350, 420, pm10_val)
    elif 421 <= pm10_val < 501:
        iaqi = cal_linear(300, 400, 420, 500, pm10_val)
    elif 501 <= pm10_val < 601:
        iaqi = cal_linear(400, 500, 500, 600, pm10_val)
    else:
        pass
    return (iaqi)

def cal_pm2_iaqi(pm2_val):
    # 计算PM2.5的IAQI
    if 0 <= pm2_val < 36:
        iaqi = cal_linear(0, 50, 0, 35, pm2_val)
    elif 36 <= pm2_val < 76:
        iaqi = cal_linear(50, 100, 35, 75, pm2_val)
    elif 76 <= pm2_val < 116:
        iaqi = cal_linear(100, 150, 75, 115, pm2_val)
    elif 116 <= pm2_val < 151:
        iaqi = cal_linear(150, 200, 115, 150, pm2_val)
    elif 151 <= pm2_val < 251:
        iaqi = cal_linear(200, 300, 150, 250, pm2_val)
    elif 251 <= pm2_val < 351:
        iaqi = cal_linear(300, 400, 250, 350, pm2_val)
    elif 351 <= pm2_val < 501:
        iaqi = cal_linear(400, 500, 350, 500, pm2_val)
    else:
        pass
    return (iaqi)

def cal_aqi(param_list):
    # AQI计算
    so2_val = param_list[0]
    no2_val = param_list[1]
    pm10_val = param_list[2]
    pm2_val = param_list[3]
    o3_val = param_list[4]
    co_val = param_list[5]

    so2_iaqi = cal_so2_iaqi(so2_val)
    no2_iaqi = cal_no2_iaqi(no2_val)
    pm10_iaqi = cal_pm10_iaqi(pm10_val)
    pm2_iaqi = cal_pm2_iaqi(pm2_val)
    o3_iaqi = cal_o3_iaqi(o3_val)
    co_iaqi = cal_co_iaqi(co_val)

    iaqi_list = []
    iaqi_list.append(so2_iaqi)
    iaqi_list.append(no2_iaqi)
    iaqi_list.append(pm10_iaqi)
    iaqi_list.append(pm2_iaqi)
    iaqi_list.append(o3_iaqi)
    iaqi_list.append(co_iaqi)
    print("iaqi_list",iaqi_list)

    AQI = max(iaqi_list)
    return (AQI)

def main(str_list):
    so2_val = float(str_list[0])
    no2_val = float(str_list[1])
    pm10_val = float(str_list[2])
    pm2_val = float(str_list[3])
    o3_val = float(str_list[4])
    co_val = float(str_list[5])
    param_list = []
    param_list.append(so2_val)
    param_list.append(no2_val)
    param_list.append(pm10_val)
    param_list.append(pm2_val)
    param_list.append(o3_val)
    param_list.append(co_val)

    # 调用AQI计算函数
    aqi_val = cal_aqi(param_list)
    print('空气质量指数(AQI):{}'.format(aqi_val))
    return (aqi_val)

if __name__ == '__main__':
    main()
first2.py是主模块
import pandas as pd
import os
import xlrd
import sys

sys.path.append(r'C:\Users\lenovo\Desktop')

import first1
import xlwt
hr_book= xlwt.Workbook()
hr_sheet=hr_book.add_sheet('aqi',cell_overwrite_ok=True)

#  将数据写入新文件
def data_write(file_path, datas):
    book = xlwt.Workbook()
    book_sheet = book.add_sheet(u'aqi',cell_overwrite_ok=True)
    #将数据写入第 i 行,第 j 列
    i = 0
    for data in datas:
        book_sheet.write(i,0,datas[i])
        i = i + 1
    book.save(file_path)

def main():
    tableget=[]
    newtable=[]
    data = xlrd.open_workbook("question1.xlsx")
    table = data.sheet_by_index(0)
    nrows = table.nrows
    ncols = table.ncols
    for row in range(0,nrows):
        for col in range(0,ncols):
            cell = table.cell(row,col).value
            tableget.append(cell)

        str_list=tableget
        aqivalue=first1.main(str_list)
        newtable.append(aqivalue)
        tableget=[]
    data_write(r'C:\Users\lenovo\Desktop\test-question1.xls', newtable)

if __name__ == "__main__":
    main()
第二问:这里我们使用的是附件一中表二的数据
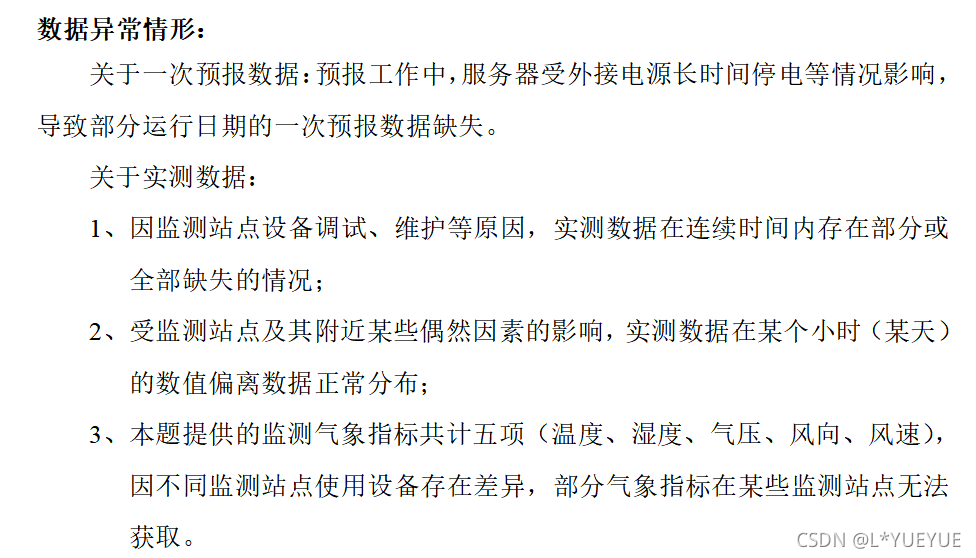
这里需要注意的是需要对excel表中的异常数据进行处理。我进行了几种处理:
1.将负值处理为空值
2.根据箱线图判断异常值,接着将异常值置空,最后用中位数替换空值。
3.遇到空值将其替换为平均值
代码如下:
import pandas as pd
import numpy as np

from matplotlib import pyplot as plt

df = pd.DataFrame(pd.read_excel(r'C:\Users\lenovo\Desktop\data.xlsx',index_col = [0, 1]))
print(df)
df.dropna(axis=0,how='all',inplace=True)

so2_a = df['SO2监测浓度(μg/m³)'].quantile(0.75)
so2_b = df['SO2监测浓度(μg/m³)'].quantile(0.25)
so2_c = df['SO2监测浓度(μg/m³)']
so2_c[(so2_c>=(so2_a-so2_b)*1.5+so2_a)|(so2_c<=so2_b-(so2_a-so2_b)*1.5)]= np.nan
so2_c.fillna(so2_c.median(),inplace=True)

no2_a = df['NO2监测浓度(μg/m³)'].quantile(0.75)
no2_b = df['NO2监测浓度(μg/m³)'].quantile(0.25)
no2_c = df['NO2监测浓度(μg/m³)']
no2_c[(no2_c>=(no2_a-no2_b)*1.5+no2_a)|(no2_c<=no2_b-(no2_a-no2_b)*1.5)]=np.nan
no2_c.fillna(no2_c.median(),inplace=True)

pm10_a = df['PM10监测浓度(μg/m³)'].quantile(0.75)
pm10_b = df['PM10监测浓度(μg/m³)'].quantile(0.25)
pm10_c = df['PM10监测浓度(μg/m³)']
pm10_c[(pm10_c>=(pm10_a-pm10_b)*1.5+pm10_a)|(pm10_c<=pm10_b-(pm10_a-pm10_b)*1.5)]=np.nan
pm10_c.fillna(pm10_c.median(),inplace=True)

pm2_a = df['PM2.5监测浓度(μg/m³)'].quantile(0.75)
pm2_b = df['PM2.5监测浓度(μg/m³)'].quantile(0.25)
pm2_c = df['PM2.5监测浓度(μg/m³)']
pm2_c[(pm2_c>=(pm2_a-pm2_b)*1.5+pm2_a)|(pm2_c<=pm2_b-(pm2_a-pm2_b)*1.5)]=np.nan
pm2_c.fillna(pm2_c.median(),inplace=True)

o3_a = df['O3监测浓度(μg/m³)'].quantile(0.75)
o3_b = df['O3监测浓度(μg/m³)'].quantile(0.25)
o3_c = df['O3监测浓度(μg/m³)']
o3_c[(o3_a>=(o3_a-o3_b)*1.5+o3_a)|(o3_c<=o3_b-(o3_a-o3_b)*1.5)]=np.nan
o3_c.fillna(o3_c.median(),inplace=True)

co_a = df['CO监测浓度(mg/m³)'].quantile(0.75)
co_b = df['CO监测浓度(mg/m³)'].quantile(0.25)
co_c = df['CO监测浓度(mg/m³)']
co_c[(co_c>=(co_a-co_b)*1.5+co_a)|(co_c<=co_b-(co_a-co_b)*1.5)]=np.nan
co_c.fillna(co_c.median(),inplace=True)

wd_a = df['温度(℃)'].quantile(0.75)
wd_b = df['温度(℃)'].quantile(0.25)
wd_c = df['温度(℃)']
wd_c[(wd_c>=(wd_a-wd_b)*1.5+wd_a)|(wd_c<=wd_b-(wd_a-wd_b)*1.5)]=np.nan
wd_c.fillna(wd_c.median(),inplace=True)

sd_a = df['湿度(%)'].quantile(0.75)
sd_b = df['湿度(%)'].quantile(0.25)
sd_c = df['湿度(%)']
sd_c[(sd_c>=(sd_a-sd_b)*1.5+sd_a)|(sd_c<=sd_b-(sd_a-sd_b)*1.5)]=np.nan
sd_c.fillna(sd_c.median(),inplace=True)

qy_a = df['气压(MBar)'].quantile(0.75)
qy_b = df['气压(MBar)'].quantile(0.25)
qy_c = df['气压(MBar)']
qy_c[(qy_c>=(qy_a-qy_b)*1.5+qy_a)|(qy_c<=qy_b-(qy_a-qy_b)*1.5)]=np.nan
qy_c.fillna(qy_c.median(),inplace=True)

fs_a = df['风速(m/s)'].quantile(0.75)
fs_b = df['风速(m/s)'].quantile(0.25)
fs_c = df['风速(m/s)']
fs_c[(fs_c>=(fs_a-fs_b)*1.5+fs_a)|(fs_c<=fs_b-(fs_a-fs_b)*1.5)]=np.nan
fs_c.fillna(fs_c.median(),inplace=True)

fx_a = df['风向(°)'].quantile(0.75)
fx_b = df['风向(°)'].quantile(0.25)
fx_c = df['风向(°)']
fx_c[(fx_c>=(fx_a-fx_b)*1.5+fx_a)|(fx_c<=fx_b-(fx_a-fx_b)*1.5)]=np.nan
fx_c.fillna(fx_c.median(),inplace=True)
df.to_excel("new.xlsx")
print(df)

so2_mean = df['SO2监测浓度(μg/m³)'].mean()
no2_mean = df['NO2监测浓度(μg/m³)'].mean()
pm10_mean = df['PM10监测浓度(μg/m³)'].mean()
pm2_mean = df['PM2.5监测浓度(μg/m³)'].mean()
o3_mean = df['O3监测浓度(μg/m³)'].mean()
co_mean = df['CO监测浓度(mg/m³)'].mean()
wd_mean = df['温度(℃)'].mean()
sd_mean = df['湿度(%)'].mean()
qy_mean = df['气压(MBar)'].mean()
fs_mean = df['风速(m/s)'].mean()
fx_mean = df['风向(°)'].mean()

df['SO2监测浓度(μg/m³)'].fillna(so2_mean)
df['NO2监测浓度(μg/m³)'].fillna(no2_mean)
df['PM10监测浓度(μg/m³)'].fillna(pm10_mean)
df['PM2.5监测浓度(μg/m³)'].fillna(pm2_mean)
df['O3监测浓度(μg/m³)'].fillna(o3_mean)
df['CO监测浓度(mg/m³)'].fillna(co_mean)
df['温度(℃)'].fillna(wd_mean)
df['湿度(%)'].fillna(sd_mean)
df['气压(MBar)'].fillna(qy_mean)
df['风速(m/s)'].fillna(fs_mean)
df['风向(°)'].fillna(fx_mean)
使用第一问代码进行处理,得到AQI值,将AQI这列加到原来的表中,之后使用spss软件进行分析画图。
初学建模,如有不对,请多多批评指正!🤣


 2182
2182


 被折叠的 条评论
为什么被折叠?
被折叠的 条评论
为什么被折叠?
 到【灌水乐园】发言


