


说明:后台需要将数据查询生成DataTable
1.后台生成JSON代码
public static string ToStaJson(DataTable dt, string jsonName)
{
StringBuilder Json = new StringBuilder();
if (jsonName.Equals("bat"))
{
Json.Append("[{\"title\":\"" + DateTime.Now.Year.ToString() + "年度" + DateTime.Now.Month.ToString() + "月份总评排行榜\",\"xAxis\":[");
if (dt.Rows.Count > 0)
{
//x轴坐标
int flagx = 1;
for (int i = 0; i < dt.Rows.Count; i++)
{
Type type = dt.Rows[i]["orgname"].GetType();
if (!string.IsNullOrEmpty(dt.Rows[i]["batscore"].ToString()))
{
Json.Append(StringFormat(dt.Rows[i]["orgname"].ToString(), type));
flagx++;
if (i < dt.Rows.Count - 1)
{
if (flagx < 10)//10为符合条件的记录数,可自行遍历,这里是偷懒的写法
{
Json.Append(",");
}
}
}
}
}
Json.Append("],");
if (dt.Rows.Count > 0)
{
Json.Append("\"yAxis\":[{\"name\":\"总分\",\"arc\":[");
int flag = 1;
for (int i = 0; i < dt.Rows.Count; i++)
{
Type type = dt.Rows[i]["batscore"].GetType();
if (!string.IsNullOrEmpty(dt.Rows[i]["batscore"].ToString()))
{
Json.Append(StringFormat(dt.Rows[i]["batscore"].ToString(), type));
flag++;
if (i < dt.Rows.Count - 1)
{
if (flag < 10)//10为符合条件的记录数,可自行遍历,这里是偷懒的写法
{
Json.Append(",");
}
}
}
}
}
Json.Append("]}]}]");
}
return Json.ToString();
}
2.前台html代码
<div class="easyui-layout" data-options="fit : true,border : false">
<div data-options="region:'north',title:'查询条件',border:false,iconCls:'icon-columns' "style="height: 70px; background: #f4f4f4;">
<div id="p" class="easyui-panel" title="" style="padding: 10px; height: 60px;
background: #f4f4f4; border-bottom: none" data-options="iconCls:'icon-columns',closable:false,
collapsible:true,minimizable:false,maximizable:false">
起:
<input id="frdate" name="frdate" type="text" class="easyui-datebox" />
止:
<input id="todate" name="todate" type="text" class="easyui-datebox" />
<a id="btnbatrankquery" href="#" class="easyui-linkbutton" data-options="iconCls:'icon-search'" οnclick="return query()">查询</a>
</div>
</div>
<div data-options="region:'center',border:false">
<div id="batrank" style="min-width:400px;height:400px"></div>
</div>
</div>
3.前台js生成highchart图
var chart;
$(document).ready(function () {
var options = {
chart: {
renderTo: 'batrank',
type: 'line'//line column
},
title: {
},
subtitle: {
text: '',
x: -20
},
xAxis: {
categories: []
},
yAxis: {
title: {
text: '总分 (分)'
},
plotLines: [{
value: 0,
width: 1,
color: '#808080'
}]
},
tooltip: {
valueSuffix: '分'
},
legend: {
layout: 'vertical',
align: 'right',
verticalAlign: 'middle',
borderWidth: 0
},
Loading: {
hideDuration: 1000, //淡出效果的持续时间(以毫秒为单位)
showDuration: 1000, //淡入效果的持续时间(以毫秒为单位)
labelStyle: {//加载标签的span的CSS样式
fontStyle: 'italic',
color: 'red',
fontSize: "40px"
},
style: {//覆盖在绘图区的加载页面的样式
position: 'absolute',
backgroundColor: 'white',
opacity: 0.5,
textAlign: 'center',
color: 'red'
}
},
credits: {
enabled: false
},
series: []
}
var oChart = null;
oChart = new Highcharts.Chart(options);
Load_SeriesData();
function Load_SeriesData() {
$.ajax({
url: '../ashx_ui/sta_comrank.ashx?type=bat',
type: 'get',
dataType: 'json',
contentType: "application/x-www-form-urlencoded; charset=utf-8",
success: function (data) {
console.log(data);
for (i = 0; i < data.length; i++) {
var DataSeries = {
name: data[i].yAxis[i].name,
data: data[i].yAxis[i].arc
};
var Addtitle = {
text:data[i].title
};
console.log(data[i].xAxis);
console.log(data[i].title);
oChart.addSeries(DataSeries);
oChart.xAxis[0].setCategories(data[i].xAxis);
oChart.setTitle(Addtitle);
}
oChart.hideLoading("Loading....");
}
});
}
});
4.前台ajax查询代码
function query() {
queryCon1 = $("#frdate").datebox('getValue');
queryCon2 = $("#todate").datebox('getValue');
$.ajax({
url: '../ashx_ui/sta_comrank.ashx?type=bat',
type: 'get',
dataType: 'json',
data: { frdate: queryCon1, todate: queryCon2 },
contentType: "application/x-www-form-urlencoded; charset=utf-8",
success: function (data) {
var options = {
chart: {
renderTo: 'batrank',
type: 'line'//line column
},
title: {
},
subtitle: {
text: '',
x: -20
},
xAxis: {
categories: []
},
yAxis: {
title: {
text: '总分 (分)'
},
plotLines: [{
value: 0,
width: 1,
color: '#808080'
}]
},
tooltip: {
valueSuffix: '分'
},
legend: {
layout: 'vertical',
align: 'right',
verticalAlign: 'middle',
borderWidth: 0
},
Loading: {
hideDuration: 1000, //淡出效果的持续时间(以毫秒为单位)
showDuration: 1000, //淡入效果的持续时间(以毫秒为单位)
labelStyle: {//加载标签的span的CSS样式
fontStyle: 'italic',
color: 'red',
fontSize: "40px"
},
style: {//覆盖在绘图区的加载页面的样式
position: 'absolute',
backgroundColor: 'white',
opacity: 0.5,
textAlign: 'center',
color: 'red'
}
},
credits: {
enabled: false
},
series: []
}
var oChart = null;
oChart = new Highcharts.Chart(options);
for (i = 0; i < data.length; i++) {
//y轴的值为数据,必须这样取,这里返回值为一行,这里的循环其实没有意义,不要也可以,直接按 data[0]取也是可以的
var DataSeries = {name: data[i].yAxis[i].name,
data: data[i].yAxis[i].arc
};
var Addtitle = {
text:data[i].title
};
oChart.addSeries(DataSeries);//取Y轴的值
oChart.xAxis[0].setCategories(data[i].xAxis);//取X轴的值
oChart.setTitle(Addtitle);//取返回的标题
}
oChart.hideLoading("Loading....");
}
});
}
5.后台ashx获取ajax传递的url
using System;
using System.Collections.Generic;
using System.Linq;
using System.Web;
using System.Web.SessionState;
using System.Data;
using OfficeOpenXml;
using OfficeOpenXml.Style;
namespace YJUI.UI.ashx_ui
{
/// <summary>
/// ui_starank 的摘要说明
/// </summary>
public class ui_starank : IHttpHandler, IReadOnlySessionState
{
private readonly YJUI.BLL.ui_regsitu dal = new YJUI.BLL.ui_regsitu();
public void ProcessRequest(HttpContext context)
{
context.Response.ContentType = "text/plain";
if (context.Session["user"] == null)
{
context.Response.Write("nosession");
context.Response.End();
}
string type = context.Request.QueryString["type"] ?? "";
if (!string.IsNullOrEmpty(type)) //数据
{
string strWhere = "";
string fromdate = context.Request.Params["frdate"];
string todate = context.Request.Params["todate"];
//判断日期区间
if (!string.IsNullOrEmpty(fromdate) && !string.IsNullOrEmpty(todate))
{
strWhere = strWhere + " and chkdate between '" + fromdate + "' and '" + todate+"'";
}
else if (string.IsNullOrEmpty(todate) && !string.IsNullOrEmpty(fromdate))
{
strWhere = strWhere + " and chkdate > '" + fromdate+"'";
}
else
{
strWhere = strWhere + " and chkdate between '" + DateTime.Now.Year + "-" + DateTime.Now.Month + "-1" + "' and '" + DateTime.Now.Year + "-" + DateTime.Now.Month + "-31" + "'";
}
//查询
if (type.Equals("download"))
{
OutputClient(dal.ExportExcel(type, strWhere));
}
else
{
string strJson = new BLL.ui_regsitu().getJson(type, strWhere);
context.Response.Write(strJson);
context.Response.End();
}
}
else
{
string action = context.Request.Params["action"];
if (action == "add")
{
Model.ui_org model = new Model.ui_org();
if (!string.IsNullOrEmpty(context.Request.Params["cc"]))
{
model.fatherid = new Guid(context.Request.Params["cc"]);
}
model.icon = context.Request.Params["txt_icon"] ?? "";
model.orgname = context.Request.Params["txt_orgname"];
model.attr_a = context.Request.Params["attr_a"];
model.attr_b = context.Request.Params["attr_b"];
model.crdate = DateTime.Now;
if (new BLL.ui_org().Add(model))
{
context.Response.Write("ok");
context.Response.End();
}
else
{
context.Response.Write("err");
context.Response.End();
}
}
else if (context.Request.Params["action"] == "dele")
{
string id = context.Request.Params["id"].Trim(',');
if (new BLL.ui_org().DeleteList(id))
{
context.Response.Write("ok");
}
else
{
context.Response.Write("err");
}
}
if (action == "edit")
{
Model.ui_org model = new Model.ui_org();
if (!string.IsNullOrEmpty(context.Request.Params["_parentId"]))
{
model.fatherid = new Guid(context.Request.Params["_parentId"]);
}
model.icon = context.Request.Params["iconCls"] ?? "";
model.orgname = context.Request.Params["orgname"];
model.attr_a = context.Request.Params["attr_a"];
model.attr_b = context.Request.Params["attr_b"];
model.id = new Guid(context.Request.Params["id"]);
// model.crdate = DateTime.Now;
if (new BLL.ui_org().Update(model))
{
context.Response.Write("ok");
context.Response.End();
}
else
{
context.Response.Write("err");
context.Response.End();
}
}
}
}
public void OutputClient(byte[] bytes)
{
HttpResponse response = HttpContext.Current.Response;
response.Buffer = true;
response.Clear();
response.ClearHeaders();
response.ClearContent();
//response.ContentType = "application/ms-excel";
response.ContentType = "application/vnd.openxmlformats - officedocument.spreadsheetml.sheet";
response.AppendHeader("Content-Type", "text/html; charset=GB2312");
response.AddHeader("Content-Disposition", string.Format("attachment; filename={0}.xlsx", DateTime.Now.ToString("yyyy-MM-dd-HH-mm-ss")));
response.Charset = "GB2312";
response.ContentEncoding = System.Text.Encoding.GetEncoding("GB2312");
response.BinaryWrite(bytes);
response.Flush();
response.End();
}
public bool IsReusable
{
get
{
return false;
}
}
}
}
h上述代码中核心的是这块
string type = context.Request.QueryString["type"] ?? "";
if (!string.IsNullOrEmpty(type)) //数据{
string strWhere = "";
string fromdate = context.Request.Params["frdate"];
string todate = context.Request.Params["todate"];
//判断日期区间
if (!string.IsNullOrEmpty(fromdate) && !string.IsNullOrEmpty(todate))
{
strWhere = strWhere + " and chkdate between '" + fromdate + "' and '" + todate+"'";
}
else if (string.IsNullOrEmpty(todate) && !string.IsNullOrEmpty(fromdate))
{
strWhere = strWhere + " and chkdate > '" + fromdate+"'";
}
else
{
strWhere = strWhere + " and chkdate between '" + DateTime.Now.Year + "-" + DateTime.Now.Month + "-1" + "' and '" + DateTime.Now.Year + "-" + DateTime.Now.Month + "-31" + "'";
}
//查询
if (type.Equals("download"))
{
OutputClient(dal.ExportExcel(type, strWhere));
}
else
{
string strJson = new BLL.ui_regsitu().getJson(type, strWhere);
context.Response.Write(strJson);
context.Response.End();
}
}
6.前台返回的json值
[{"title":"2018年度3月份总评排行榜","xAxis":["部门1","部门2","部门3","部门4","部门5","部门6","部门7","部门8","部门9"],"yAxis":[{"name":"总分","arc":[520,516,511,510,501,500,496,495,492]}]}]
7.效果图
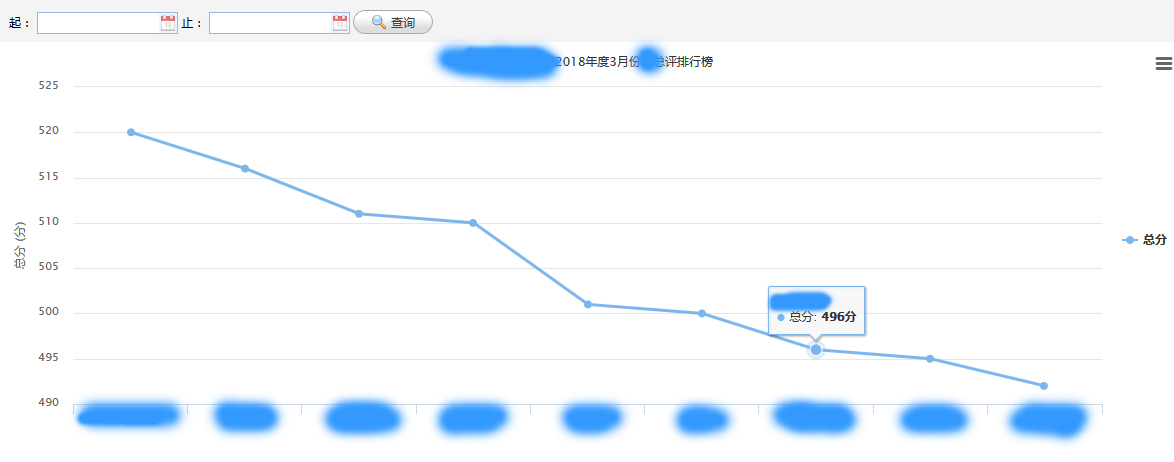
有什么问题可以留言,自己第一次用highchart做统计,也是一步一步看API、Demo琢磨出来的。。。。。


 323
323

 被折叠的 条评论
为什么被折叠?
被折叠的 条评论
为什么被折叠?
 到【灌水乐园】发言


