


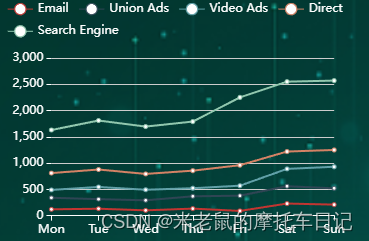
实现效果:

html:
<div
       ref="echartOne"
       id="echartOne"
       style="width: 100%; height: 100%"
></div>
js:
    getEchartOne() {
      let chart = this.$echarts.init(this.$refs.echartOne);
      chart.setOption({
        title: {
          text: "Stacked Line"
        },
        tooltip: {
          trigger: "axis"
        },
        legend: {
          data: ["Email", "Union Ads", "Video Ads", "Direct", "Search Engine"]
        },
        grid: {
          left: "3%",
          right: "4%",
          bottom: "3%",
          containLabel: true
        },
        toolbox: {
          feature: {
            saveAsImage: {}
          }
        },
        xAxis: {
          type: "category",
          boundaryGap: false,
          data: ["Mon", "Tue", "Wed", "Thu", "Fri", "Sat", "Sun"]
        },
        yAxis: {
          type: "value"
        },
        series: [
          {
            name: "Email",
            type: "line",
            stack: "Total",
            data: [120, 132, 101, 134, 90, 230, 210]
          },
          {
            name: "Union Ads",
            type: "line",
            stack: "Total",
            data: [220, 182, 191, 234, 290, 330, 310]
          },
          {
            name: "Video Ads",
            type: "line",
            stack: "Total",
            data: [150, 232, 201, 154, 190, 330, 410]
          },
          {
            name: "Direct",
            type: "line",
            stack: "Total",
            data: [320, 332, 301, 334, 390, 330, 320]
          },
          {
            name: "Search Engine",
            type: "line",
            stack: "Total",
            data: [820, 932, 901, 934, 1290, 1330, 1320]
          }
        ]
      });
//自适应部分
      window.addEventListener('resize', function () {
        chart.resize()
})
    },
补充知识点:
更改标题,图例的颜色,x轴和y轴的颜色变为白色
{
        title: {
          text: ""
        },
        tooltip: {
          trigger: "axis",
          axisPointer: {
            type: "shadow"
          }
        },
        legend: {
          textStyle: {
            fontSize: 12,
            color: "#FFFFFF"
          }
        },
        grid: {
          left: "3%",
          right: "4%",
          bottom: "3%",
          containLabel: true
        },
        xAxis: [
          {
            type: "category",
            boundaryGap: [0, 0.01],
            data: citylist,
            // axisLabel: {
            //     color: fontColor,
            //     color: '#FFFFFF',
            //   },
            axisLine: {
              show: true,
              lineStyle: {
                color: "#FFFFFF"
              }
            }
          }
        ],
        yAxis: {
          type: "value",
          axisLine: {
            show: false,
            lineStyle: {
              color: "white"
            }
          }
        },
        series: [
          {
            name: "产品个数/个",
            type: "bar",
            data: sumList,
            textStyle: {
              color: "#00FFFF"
            },
            itemStyle: {
              normal: {
                color: "#00FFFF"
              }
            }
          },
          {
            name: "溯源次数/次",
            type: "bar",
            data: numList,
            itemStyle: {
              normal: {
                color: "#FFFF00"
              }
            }
          }
        ]
      }


 1415
1415

 被折叠的 条评论
为什么被折叠?
被折叠的 条评论
为什么被折叠?
 到【灌水乐园】发言


