


1. 首先,我们先来弄清楚到底什么是ftrace
它的作者:Steven Rostedt
对于ftrace作者这样说,
ftrace是一个追踪内核的内部操作的工具,这里提到的追踪有几大类
一、内核中的静态追踪器Static tracepoints within the kernel(event tracing)
①scheduling(调度)
②interrupts(中断)
③file systems(文件系统)
④virtual guest connections with host(虚拟用户和主机的连接)
二、动态的内核函数追踪(Dynamic kernel function tracing)
①trace all functions within the kernel(追踪内核中的所有函数)
②pick and choose what functions to trace(挑选要追踪的函数)
③call graphs(函数调用关系图)
④stack usage(函数栈的使用???)
三、延时追踪器(Latency tracers)
①how long interrupts are disabled
②how long preemption(抢占) is disabled
③how long interrupts and/or preemption is disabled
四、唤醒延时(Wake up latency)
①how long it takes a process to run after it is woken
维基百科给的定义是这样的
ftrace (abbreviated from Function Tracer) is a tracing framework for the Linux kernel. Although its original name, Function Tracer, came from ftrace’s ability to record information related to various function calls performed while the kernel is running, ftrace’s tracing capabilities cover a much broader range of kernel’s internal operations.
With its various tracer plugins, ftrace can be targeted at different static tracepoints, such as scheduling events, interrupts, memory-mapped I/O, CPU power state transitions, and operations related to file systems and virtualization. Also, dynamic tracking of kernel function calls is available, optionally restrictable to a subset of functions by using globs, and with the possibility to generate call graphs and provide stack usage reports. At the same time, ftrace can be used to measure various latencies within the Linux kernel, such as for how long interrupts or preemption are disabled.
An ftrace-enabled Linux kernel is built by enabling the CONFIG_FUNCTION_TRACER kernel configuration option. The entire runtime interaction with ftrace is performed through readable and writable virtual files contained in a specifically mounted debugfs file system; as a result, ftrace requires no specialized userspace utilities to operate. However, there are additional userspace utilities that provide more advanced features for data recording, analysis and visualization; examples of such utilities are trace-cmd and KernelShark.
Internally, ftrace relies on the gcc’s profiling mechanism to prepend machine instructions to the compiled versions of all source-level kernel functions, which redirect the execution of functions to the ftrace’s trampolines and tracer plugins that perform the actual tracing. These “entry point” instructions created by gcc are altered by ftrace when the kernel is booted, and varied later at runtime by ftrace between NOPs and actual jumps to the tracing trampolines, depending on the tracing types and options configured at runtime.
ftrace is developed primarily by Steven Rostedt, and it was merged into the Linux kernel mainline in kernel version 2.6.27, which was released on October 9, 2008
2. and 接下来让我们看看它是怎么应用的
通常,我们使用的linux系统其内核已经做了对ftrace的支持,所以我们这里先讲讲如何在linux系统中使用ftrace
ftrace 通过 debugfs 向用户态提供访问接口,debugfs会创建一个目录/sys/kernel/debug, 在这个目录下有一个tracing目录,其中存放了提供给用户访问的ftrace服务接口文档
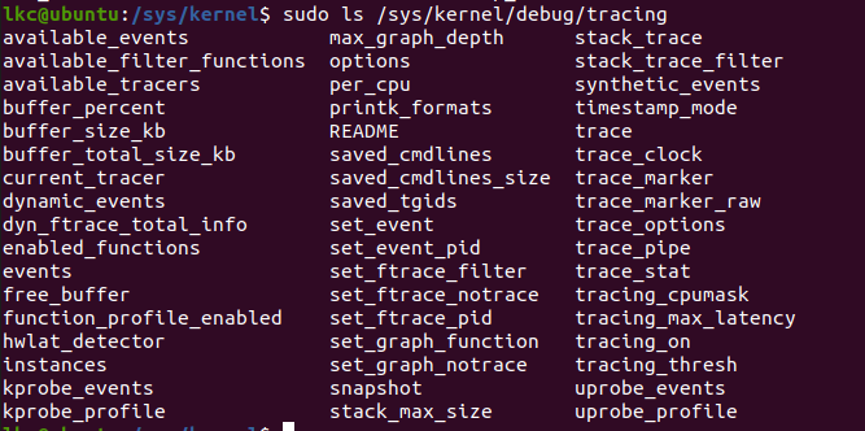
- README文件里面对此目录下面的文件作了简要的介绍,有兴趣的自行查看吧
- current_tracer用于设置或显示当前使用的跟踪器;使用echo命令将跟踪器名字写入该文件可以切换到不同的跟踪器。系统启动后,其缺省值为 nop ,即不做任何跟踪操作。在执行完一段跟踪任务后,可以通过向该文件写入 nop 来重置跟踪器。
- available_tracers记录了当前编译进内核的跟踪器的列表,可以通过 cat 查看其内容;写 current_tracer 文件时用到的跟踪器名字必须在该文件列出的跟踪器名字列表中。
- trace文件提供了查看获取到的跟踪信息的接口。可以通过 cat 等命令查看该文件以查看跟踪到的内核活动记录,也可以将其内容保存为记录文件以备后续查看。
- tracing_on用于控制跟踪的暂停。有时候在观察到某些事件时想暂时关闭跟踪,可以将 0 写入该文件以停止跟踪,这样跟踪缓冲区中比较新的部分是与所关注的事件相关的;写入 1 可以继续跟踪。
- set_graph_function设置要清晰显示调用关系的函数,显示的信息结构类似于 C 语言代码,这样在分析内核运作流程时会更加直观一些。在使用 function_graph 跟踪器时使用;缺省为对所有函数都生成调用关系序列,可以通过写该文件来指定需要特别关注的函数。
- buffer_size_kb用于设置单个 CPU 所使用的跟踪缓存的大小。跟踪器会将跟踪到的信息写入缓存,每个 CPU 的跟踪缓存是一样大的。跟踪缓存实现为环形缓冲区的形式,如果跟踪到的信息太多,则旧的信息会被新的跟踪信息覆盖掉。注意,要更改该文件的值需要先将 current_tracer 设置为 nop 才可以。
- available_filter_functions记录了当前可以跟踪的内核函数。对于不在该文件中列出的函数,无法跟踪其活动。
- set_ftrace_filter和 set_ftrace_notrace在编译内核时配置了动态 ftrace (选中 CONFIG_DYNAMIC_FTRACE 选项)后使用。前者用于显示指定要跟踪的函数,后者则作用相反,用于指定不跟踪的函数。如果一个函数名同时出现在这两个文件中,则这个函数的执行状况不会被跟踪。这些文件还支持简单形式的含有通配符的表达式,这样可以用一个表达式一次指定多个目标函数;
在开篇的定义中我们引用了作者以及维基百科的描述来了解ftrace是干什么的,它都跟踪了哪些东西,现在我们来实际操作一下看看当前系统中都提供了哪些跟踪器吧
root@ubuntu:/sys/kernel/debug/tracing# cat available_tracers
hwlat blk mmiotrace function_graph wakeup_dl wakeup_rt wakeup function nop
- nop跟踪器不会跟踪任何内核活动,将 nop 写入 current_tracer 文件可以删除之前所使用的跟踪器,并清空之前收集到的跟踪信息,即刷新 trace 文件。
- function跟踪器可以跟踪内核函数的执行情况;可以通过文件 set_ftrace_filter 显示指定要跟踪的函数。
- function_graph跟踪器可以显示类似 C 源码的函数调用关系图,这样查看起来比较直观一些;可以通过文件 set_grapch_function 显示指定要生成调用流程图的函数。
ftrace还支持其他一些跟踪器例如sched_switch跟踪器可以对内核中的进程调度活动进行跟踪、irqsoff跟踪器和 preemptoff跟踪器分别跟踪关闭中断的代码和禁止进程抢占的代码,并记录关闭的最大时长,preemptirqsoff跟踪器则可以看做它们的组合。
ftrace 框架支持扩展添加新的跟踪器。读者可以参考内核源码包中 Documentation/trace 目录下的文档以及 kernel/trace 下的源文件,以了解其它跟踪器的用途和如何添加新的跟踪器。
fucntion 跟踪器的使用
function 跟踪器可以跟踪内核函数的调用情况,可用于调试或者分析 bug ,还可用于了解和观察 Linux 内核的执行过程。下面给出使用 function 跟踪器的示例。
root@ubuntu:/sys/kernel/debug/tracing# pwd
/sys/kernel/debug/tracing
root@ubuntu:/sys/kernel/debug/tracing# echo function > current_tracer
root@ubuntu:/sys/kernel/debug/tracing# echo 1 > tracing_on
# 在这里等待一段时间,
root@ubuntu:/sys/kernel/debug/tracing# echo 0 > tracing_on

root@ubuntu:/sys/kernel/debug/tracing# cat trace | head -20
# tracer: function
#
# entries-in-buffer/entries-written: 205147/8183627   #P:4
#
#                              _-----=> irqs-off
#                             / _----=> need-resched
#                            | / _---=> hardirq/softirq
#                            || / _--=> preempt-depth
#                            ||| /     delay
#           TASK-PID   CPU#  ||||    TIMESTAMP  FUNCTION
#              | |       |   ||||       |         |
           <...>-38381 [000] d... 10529.718505: __update_load_avg_cfs_rq <-update_blocked_averages
           <...>-38381 [000] d... 10529.718505: __accumulate_pelt_segments <-__update_load_avg_cfs_rq
           <...>-38381 [000] d... 10529.718506: __update_load_avg_cfs_rq <-update_blocked_averages
           <...>-38381 [000] d... 10529.718506: __accumulate_pelt_segments <-__update_load_avg_cfs_rq
           <...>-38381 [000] d... 10529.718507: __update_load_avg_cfs_rq <-update_blocked_averages
           <...>-38381 [000] d... 10529.718507: __accumulate_pelt_segments <-__update_load_avg_cfs_rq
           <...>-38381 [000] d... 10529.718508: __update_load_avg_cfs_rq <-update_blocked_averages
           <...>-38381 [000] d... 10529.718509: __accumulate_pelt_segments <-__update_load_avg_cfs_rq
           <...>-38381 [000] d... 10529.718509: __update_load_avg_cfs_rq <-update_blocked_averages
           <idle>-0     [000] d... 10818.707183: quiet_vmstat <-tick_nohz_idle_stop_tick
           <idle>-0     [000] d... 10818.707184: need_update <-quiet_vmstat
           <idle>-0     [000] d... 10818.707184: first_online_pgdat <-need_update
           <idle>-0     [000] d... 10818.707186: next_zone <-need_update
           <idle>-0     [000] d... 10818.707187: next_zone <-need_update
           <idle>-0     [000] d... 10818.707187: next_zone <-need_update
           <idle>-0     [000] d... 10818.707187: next_zone <-need_update
           <idle>-0     [000] d... 10818.707188: next_zone <-need_update
           <idle>-0     [000] d... 10818.707188: next_online_pgdat <-next_zone

root@ubuntu:/sys/kernel/debug/tracing#
trace 文件给出的信息格式很清晰。首先,字段“tracer:”给出了当前所使用的跟踪器的名字,这里为 function 跟踪器。然后是跟踪信息记录的格式,TASK 字段对应任务的名字,PID 字段则给出了任务的进程 ID,字段 CPU# 表示运行被跟踪函数的 CPU 号,这里可以看到 idle 进程运行在 0 号 CPU 上,其进程 ID 是 0 ;字段 TIMESTAMP 是时间戳,其格式为“secs.usecs”,表示执行该函数时对应的时间戳;FUNCTION 一列则给出了被跟踪的函数,函数的调用者通过符号 “<-” 标明,这样可以观察到函数的调用关系。
function_graph跟踪器的使用
在 function 跟踪器给出的信息中,可以通过 FUNCTION 列中的符号 “<-” 来查看函数调用关系,但是由于中间会混合不同函数的调用,导致看起来非常混乱,十分不方便。function_graph 跟踪器则可以提供类似 C 代码的函数调用关系信息。通过写文件 set_graph_function 可以显示指定要生成调用关系的函数,缺省会对所有可跟踪的内核函数生成函数调用关系图。下面给出了使用 function_grapch 跟踪器的示例,示例中将内核函数 __do_fault 作为观察对象,该函数在内核运作过程中会被频繁调用。
oot@ubuntu:/sys/kernel/debug/tracing# echo function_graph > current_tracer
root@ubuntu:/sys/kernel/debug/tracing# cat trace
# tracer: function_graph
#
# CPU  DURATION                  FUNCTION CALLS
# |     |   |                     |   |   |   |
root@ubuntu:/sys/kernel/debug/tracing# cat trace
# tracer: function_graph
#
# CPU  DURATION                  FUNCTION CALLS
# |     |   |                     |   |   |   |
root@ubuntu:/sys/kernel/debug/tracing# echo __do_fault > set_graph_function
root@ubuntu:/sys/kernel/debug/tracing# echo 1 > tracing_on
root@ubuntu:/sys/kernel/debug/tracing# echo 0 > tracing_on
root@ubuntu:/sys/kernel/debug/tracing# cat trace | head -20
# tracer: function_graph
#
# CPU  DURATION                  FUNCTION CALLS
# |     |   |                     |   |   |   |
   1)               |  __do_fault() {
   1)               |    pte_alloc_one() {
   1)               |      alloc_pages_current() {
   1)   0.725 us    |        get_task_policy.part.35();
   1)   0.534 us    |        policy_nodemask();
   1)   0.540 us    |        policy_node();
   1)               |        __alloc_pages_nodemask() {
   1)               |          _cond_resched() {
   1)   0.565 us    |            rcu_all_qs();
   1)   1.580 us    |          }
   1)   0.534 us    |          should_fail_alloc_page();
   1)               |          get_page_from_freelist() {
   1)   0.730 us    |            __inc_numa_state();
   1)   0.530 us    |            __inc_numa_state();
   1)   0.675 us    |            kernel_poison_pages();
   1)   0.644 us    |            page_poisoning_enabled();
root@ubuntu:/sys/kernel/debug/tracing# echo > set_graph_function
root@ubuntu:/sys/kernel/debug/tracing#
在文件 trace 的输出信息中,首先给出的也是当前跟踪器的名字,这里是 function_graph 。接下来是详细的跟踪信息,可以看到,函数的调用关系以类似 C 代码的形式组织。
CPU 字段给出了执行函数的 CPU 号,本例中都为 1 号 CPU。DURATION 字段给出了函数执行的时间长度,以 us 为单位。FUNCTION CALLS 则给出了调用的函数,并显示了调用流程。注意,对于不调用其它函数的函数,其对应行以“;”结尾,而且对应的 DURATION 字段给出其运行时长;对于调用其它函数的函数,则在其“}”对应行给出了运行时长,该时间是一个累加值,包括了其内部调用的函数的执行时长。DURATION 字段给出的时长并不是精确的,它还包含了执行 ftrace 自身的代码所耗费的时间,所以示例中将内部函数时长累加得到的结果会与对应的外围调用函数的执行时长并不一致;不过通过该字段还是可以大致了解函数在时间上的运行开销的。最后通过 echo 命令重置了文件 set_graph_function 。
sched_switch 跟踪器
sched_switch 跟踪器可以对进程的调度切换以及之间的唤醒操作进行跟踪
由于试验系统暂时没有此跟踪器,故暂时搁置,待随后扩展后补充
irqsoff 跟踪器
当关闭中断时,CPU 会延迟对设备的状态变化做出反应,有时候这样做会对系统性能造成比较大的影响。irqsoff 跟踪器可以对中断被关闭的状况进行跟踪,有助于发现导致较大延迟的代码;当出现最大延迟时,跟踪器会记录导致延迟的跟踪信息,文件 tracing_max_latency 则记录中断被关闭的最大延时。
由于试验系统暂时没有此跟踪器,故暂时搁置,待随后扩展后补充
跟踪指定模块中的函数
通过文件 set_ftrace_filter 可以指定要跟踪的函数,缺省目标为所有可跟
踪的内核函数;可以将感兴趣的函数通过 echo 写入该文件。为了方便使
用,set_ftrace_filter 文件还支持简单格式的通配符。
- begin*选择所有名字以 begin 字串开头的函数
- *middle*选择所有名字中包含 middle 字串的函数
- *end选择所有名字以 end 字串结尾的函数
需要注意的是,这三种形式不能组合使用,比如“begin*middle*end”实际的效果与“begin”相同。另外,使用通配符表达式时,需要用单引号将其括起来.
通过该文件还可以指定属于特定模块的函数,这要用到 mod 指令。指定模块的格式为:echo ':mod:module_name' > set_ftrace_filter
下面给出了一个指定跟踪模块e1000中的函数的例子。可以看到,指定跟踪模块 e1000 中的函数会将文件 set_ftrace_filter 的内容设置为只包含该模块中的函数。
root@ubuntu:/sys/kernel/debug/tracing# echo ':mod:e1000' > set_ftrace_filter
root@ubuntu:/sys/kernel/debug/tracing# cat set_ftrace_filter | head -5
e1000_alloc_dummy_rx_buffers [e1000]
e1000_fix_features [e1000]
e1000_setup_rctl [e1000]
e1000_configure_rx [e1000]
e1000_update_itr [e1000]
root@ubuntu:/sys/kernel/debug/tracing#
3. 内核头文件 include/linux/kernel.h 中描述了 ftrace 提供的工具函数的原型,这些函数包括 trace_printk、tracing_on/tracing_off 等。接下来通过示例模块程序展示如何在代码中使用这些工具函数
使用 trace_printk 打印跟踪信息
ftrace 提供了一个用于向 ftrace 跟踪缓冲区输出跟踪信息的工具函数,叫做 trace_printk(),它的使用方式与 printk() 类似。可以通过 trace 文件读取该函数的输出。从头文件 include/linux/kernel.h 中可以看到,在激活配置 CONFIG_TRACING 后,trace_printk() 定义为宏:
#define trace_printk(fmt, args...)
下面通过一个示例模块 ftrace_demo 来演示如何使用 trace_printk() 向跟踪缓冲区输出信息,以及如何查看这些信息。这里的示例模块程序中仅提供了初始化和退出函数,这样读者不会因为需要为模块创建必要的访问接口比如设备文件而分散注意力。注意,编译模块时要加入 -pg 选项。
/*
* ftrace_demo.c
*/
#include <linux/init.h> //一些初始化的函数如module_init()
#include <linux/module.h> //所有内核模块都必须包含这个头文件
#include <linux/kernel.h> //使用内核信息优先级时要包含这个

MODULE_LICENSE("GPL"); //模块许可声明

static int ftrace_demo_init(void)
{
    trace_printk("Can not see this in trace unless loaded for the second time\n");
    return 0;
}

static void ftrace_demo_exit(void)
{
    trace_printk("Module unloading\n");
}

module_init(ftrace_demo_init); //使用命令insmod加载该模块时调用
module_exit(ftrace_demo_exit);//使用命令rmmod卸载此模块时调用
我们需要将以上C语言源代码编译为模块目标文件,其扩展名格式为ko
下面是编译用的Makefile文件内容
ifneq ($(KERNELRELEASE),)
        obj-m:=hello.o
else
        KDIR:=/lib/modules/$(shell uname -r)/build
		longPWD:=$(shell pwd)
all:
        make -C $(KDIR) M=$(longPWD) modules
clean:
        rm -f *.ko *.o *.symvers *.cmd *.cmd.o
endif
将Makefile与源文件放在同一个目录下,使用make命令即可完成编译,接下来我们就可以做使用ftrace调试内核程序的实验了
root@ubuntu:/sys/kernel/debug/tracing# pwd
/sys/kernel/debug/tracing
root@ubuntu:/sys/kernel/debug/tracing# echo function_graph > current_tracer
root@ubuntu:/sys/kernel/debug/tracing# insmod /home/longlong/Desktop/longkernel/hello.ko
insmod: ERROR: could not insert module /home/longlong/Desktop/longkernel/hello.ko: File exists
root@ubuntu:/sys/kernel/debug/tracing# rmmod hello
root@ubuntu:/sys/kernel/debug/tracing# insmod /home/longlong/Desktop/longkernel/hello.ko
root@ubuntu:/sys/kernel/debug/tracing# echo ':mod:hello' > set_ftrace_filter
root@ubuntu:/sys/kernel/debug/tracing# cat set_ftrace_filter
hello_init [hello]
hello_exit [hello]
root@ubuntu:/sys/kernel/debug/tracing# rmmod hello
root@ubuntu:/sys/kernel/debug/tracing# echo 1 > tracing_on
root@ubuntu:/sys/kernel/debug/tracing# insmod /home/longlong/Desktop/longkernel/hello.ko
root@ubuntu:/sys/kernel/debug/tracing# rmmod hello
root@ubuntu:/sys/kernel/debug/tracing# cat trace
# tracer: function_graph
#
# CPU  DURATION                  FUNCTION CALLS
# |     |   |                     |   |   |   |
   1)               |  /* can not see this in trace unless loaded for the second time */
   2)               |  /* Module unloading */
root@ubuntu:/sys/kernel/debug/tracing# echo 0 tracing_on
0 tracing_on
root@ubuntu:/sys/kernel/debug/tracing# echo 0 > tracing_on
root@ubuntu:/sys/kernel/debug/tracing#
在这个例子中,使用 mod 指令显式指定跟踪模块 hello 中的函数,这需要提前加载该模块,否则在写文件set_ftrace_filter 时会因为找不到该模块报错。这样在第一次加载模块时,其初始化函数hello_init 中调用 trace_printk 打印的语句就跟踪不到了。因此这里会将其卸载,然后激活跟踪,再重新进行模块hello的加载与卸载操作。最终可以从文件 trace 中看到模块在初始化和退出时调用 trace_printk() 输出的信息。
实践中,可以在模块的功能函数中加入对 trace_printk 的调用,这样可以记录模块的运作情况,然后对其特定功能进行调试优化。还可以将对 trace_printk() 的调用通过宏来控制编译,这样可以在调试时将其开启,在最终发布时将其关闭。
在代码中使用 tracing_on/tracing_off 控制跟踪信息的记录
在跟踪过程中,有时候在检测到某些事件发生时,想要停止跟踪信息的记录,这样,跟踪缓冲区中较新的数据是与该事件有关的。在用户态,可以通过向文件 tracing_on 写入 0 来停止记录跟踪信息,写入 1 会继续记录跟踪信息。而在内核代码中,可以通过函数 tracing_on() 和 tracing_off() 来做到这一点,它们的行为类似于对 /sys/kernel/debug/tracing 下的文件 tracing_on 分别执行写 1 和 写 0 的操作。使用这两个函数,会对跟踪信息的记录控制地更准确一些,这是因为在用户态写文件 tracing_on 到实际暂停跟踪,中间由于上下文切换、系统调度控制等可能已经经过较长的时间,这样会积累大量的跟踪信息,而感兴趣的那部分可能会被覆盖掉了。
现在对hello.c文件稍作修改,来进行本次实验
/*
* hello2.c
*     modified to demostrate the usage of tracing_off
*/
#include <linux/init.h>
#include <linux/module.h>
#include <linux/kernel.h>

MODULE_LICENSE("GPL");

static int hello_init(void)
{
    trace_printk("hello_init called\n");
    tracing_off();
    return 0;
}

static void hello_exit(void)
{
    trace_printk("hello_exit called\n");
    tracing_off();
}

module_init(hello_init);
module_exit(hello_exit);
root@ubuntu:/sys/kernel/debug/tracing# echo function > current_tracer
root@ubuntu:/sys/kernel/debug/tracing# echo 1 > trac
trace                trace_marker         trace_options        trace_stat/          tracing_max_latency  tracing_thresh
trace_clock          trace_marker_raw     trace_pipe           tracing_cpumask      tracing_on
root@ubuntu:/sys/kernel/debug/tracing# echo 1 > tracing_on
#此处需使用命令insmod加载hello2模块
root@ubuntu:/sys/kernel/debug/tracing# cat tracing_on
0
root@ubuntu:/sys/kernel/debug/tracing# cat trace | wc -l
12
root@ubuntu:/sys/kernel/debug/tracing# cat trace | grep -n hello_init
12:           <...>-8262  [003] .... 24935.952010: hello_init: hello_init called
root@ubuntu:/sys/kernel/debug/tracing# echo 1 > tracing_on
#此处需使用rmmod命令卸载hello2模块
root@ubuntu:/sys/kernel/debug/tracing# cat tracing_on
0
root@ubuntu:/sys/kernel/debug/tracing# wc -l trace
12 trace
root@ubuntu:/sys/kernel/debug/tracing# grep -n hello_exit trace
12:           <...>-8269  [000] .... 25079.385514: 0xffffffffc0477035: hello_exit called
root@ubuntu:/sys/kernel/debug/tracing#
在这个例子中,跟踪开始之前需要确保 tracing_on 的值为 1。跟踪开始后,加载模块 ftrace_demo,其初始化方法 ftrace_demo_init 被调用,该方法会调用 tracing_off() 函数来暂停跟踪信息的记录,这时文件 tracing_on 的值被代码设置为 0。查看文件 trace,可以看到 ftrace_demo_init 相关的记录位于跟踪信息的末端,这是因为从调用 trace_off() 到其生效需要一段时间,这段时间中的内核活动会被记录下来;相比从用户态读写 tracing_on 文件,这段时间开销要小了许多。卸载模块时的情况与此类似。从这里可以看到,在代码中使用 tracing_off() 可以控制将感兴趣的信息保存在跟踪缓冲区的末端位置,不会很快被新的信息所覆盖,便于及时查看。
实际代码中,可以通过特定条件(比如检测到某种异常状况,等等)来控制跟踪信息的记录,函数的使用方式类似如下的形式:
if (condition)
    tracing_on() or tracing_off()
跟踪模块运行状况时,使用 ftrace 命令操作序列在用户态进行必要的设置,而在代码中则可以通过 traceing_on() 控制在进入特定代码区域时开启跟踪信息,并在遇到某些条件时通过 tracing_off() 暂停;读者可以在查看完感兴趣的信息后,将 1 写入 tracing_on 文件以继续记录跟踪信息。实践中,可以通过宏来控制是否将对这些函数的调用编译进内核模块,这样可以在调试时将其开启,在最终发布时将其关闭。
用户态的应用程序可以通过直接读写文件 tracing_on 来控制记录跟踪信息的暂停状态,以便了解应用程序运行期间内核中发生的活动。
总结
基本的东西已经学完,然而心里还是虚虚的,寻找时间一定要尝试一下使用ftrace做一些东西。


 2万+
2万+


 被折叠的 条评论
为什么被折叠?
被折叠的 条评论
为什么被折叠?
 到【灌水乐园】发言


