


前言
上周部门组织前端代码审查,同事分析了一下使用canvas来实现甘特图的业务。大体常见是在el-table里显示甘特图,最开始是通过span标签来进行渲染的,但是存在一个比较严重的问题。假设一个插槽内渲染3个span标签,一行有20列,这就是60个span标签 ;如果一次查询100条数据就会有6000个span标签。这样造成的结果就是当数据量特别大时需要渲染特别多的dom元素,最终导致页面卡死,无法进行其他操作。
同事的优化方案是,用canvas来替换span 标签,这样一个插槽内只需要一个canvas标签,这样最终只需要渲染 列数 * 查询的总条数,这样减少了大量dom元素的渲染。
感觉方案还是非常不错的,就自己抽空写了一个简单的demo
实现
用canvas实现甘特图其实最终还是转换成用canvas来画矩形。对canvas不熟悉的可以看一下我的这两篇文章
基本可以简单入门(我自己水平也就是皮毛,就是做一点简单的东西也要查一下😅)
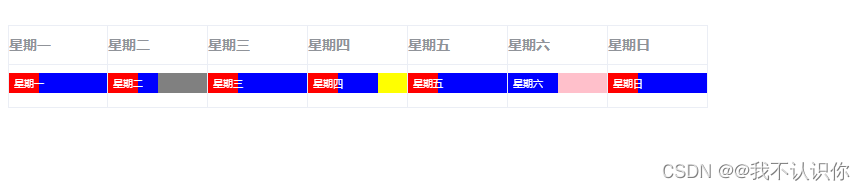
效果图
demo代码
<template>
    <div>

        <el-table :data="tableData" style="width: 700px;" border>
            <el-table-column prop="monday" label="星期一">
                <template v-slot="scope">
                    <gantt-chart id="monday" :width="100" desc="星期一" descColor="#fff" :list="scope.row.monday">
                    </gantt-chart>
                </template>
            </el-table-column>
            <el-table-column prop="tuesday" label="星期二">
                <template v-slot="scope">
                    <gantt-chart id="tuesday" :width="100" desc="星期二" descColor="#fff" :list="scope.row.tuesday">
                    </gantt-chart>
                </template>
            </el-table-column>
            <el-table-column prop="wednesday" label="星期三">
                <template v-slot="scope">
                    <gantt-chart id="wednesday" :width="100" desc="星期三" descColor="#fff"
                        :list="scope.row.wednesday"></gantt-chart>
                </template>
            </el-table-column>
            <el-table-column prop="thursday" label="星期四">
                <template v-slot="scope">
                    <gantt-chart id="thursday" :width="100" desc="星期四" descColor="#fff" :list="scope.row.thursday">
                    </gantt-chart>
                </template>
            </el-table-column>
            <el-table-column prop="friday" label="星期五">
                <template v-slot="scope">
                    <gantt-chart id="friday" :width="100" desc="星期五" descColor="#fff" :list="scope.row.friday">
                    </gantt-chart>
                </template>
            </el-table-column>
            <el-table-column prop="saturday" label="星期六">
                <template v-slot="scope">
                    <gantt-chart id="saturday" :width="100" desc="星期六" descColor="#fff" :list="scope.row.saturday">
                    </gantt-chart>
                </template>
            </el-table-column>
            <el-table-column prop="sunday" label="星期日">
                <template v-slot="scope">
                    <gantt-chart id="sunday" :width="100" desc="星期日" descColor="#fff" :list="scope.row.sunday">
                    </gantt-chart>
                </template>
            </el-table-column>
        </el-table>
    </div>
</template>

<script setup lang="ts">
import { ref } from 'vue';
import ganttChart from './gantt-chart.vue';

const tableData = ref([
    {
        monday: [
            {
                width: 30,
                color: 'red'
            },
            {
                width: 70,
                color: 'blue'
            }
        ],
        tuesday: [
            {
                width: 30,
                color: 'red'
            },
            {
                width: 20,
                color: 'blue'
            },
            {
                width: 50,
                color: 'gray'
            }
        ],
        wednesday: [
            {
                width: 30,
                color: 'red'
            },
            {
                width: 70,
                color: 'blue'
            }
        ],
        thursday: [
            {
                width: 30,
                color: 'red'
            },
            {
                width: 40,
                color: 'blue'
            },
            {
                width: 30,
                color: 'yellow'
            }
        ],
        friday: [
            {
                width: 30,
                color: 'red'
            },
            {
                width: 70,
                color: 'blue'
            }
        ],
        saturday: [
            {
                width: 50,
                color: 'blue'
            },
            {
                width: 50,
                color: 'pink'
            }
        ],
        sunday: [
            {
                width: 30,
                color: 'red'
            },
            {
                width: 70,
                color: 'blue'
            }
        ]
    }
]);
</script>
<style scoped lang="scss">
:deep(.el-table .cell) {
    padding: 0;
}

:deep(.el-table--border .el-table__cell:first-child .cell) {
    padding-left: 0;
}
</style>
组件代码
本来是还要考虑界限问题的,每一个小矩形会不会超出总的容器宽度。后来觉得没必要搞的这么麻烦,本来就是根据实际业务来实现的,完全可以使用标准的数据格式。
<template>
    <div>
        <canvas :id="id" :width="width" :height="height"></canvas>
    </div>
</template>

<script setup lang="ts">
import { ref, onMounted, nextTick } from 'vue';

// 每次绘制矩形时的偏移量
const residueWidth = ref(0);

interface ganttChartItem {
    // 宽度
    width: number,
    // 颜色
    color: string
}

interface Props {
    // id
    id:string
    // 宽度
    width: number,
    // 高度
    height?: number,
    // 是否初始化
    init?: boolean,
    // 子项
    list?: Array<ganttChartItem>,
    // 是否显示描述
    desc?:string
    // 描述颜色
    descColor?:string
}

const props = withDefaults(defineProps<Props>(), {
    // 高度默认20
    height: 20,
    // 默认初始化
    init: true,
    // 子项默认为空
    list: () => [],
    // 是否显示描述
    desc: '',
    // 描述颜色
    descColor: ''
});

onMounted(() => {
    draw();
});

// 绘制
const draw = () => {
    // 获取对象
    const c = document.getElementById(props.id);
    // 获取2d画布
    const context = c.getContext('2d');
    if (props.list.length > 0) {
        // 要加上nextTick不然会先绘制文本,导致文本在矩形下面
        nextTick(() => {
            for (let i = 0; i < props.list.length; i++) {
            // 循环绘制,这里不考虑宽度是否超出的问题,默认数据都是合理的
                drawRectangle(context, props.list[i].color, residueWidth.value, props.list[i].width);
                residueWidth.value += props.list[i].width;
            }
            drawDesc(context);
        });
    }
};
// 绘制矩形
const drawRectangle = (context, color: string, x: number, width: number) => {
    context.fillStyle = color; // 指定填充颜色
    context.fillRect(x, 0, width, props.height); // 填充
};

// 绘制描述
const drawDesc = (context) => {
    if (props.desc && props.descColor) {
        context.fillStyle = props.descColor;
        context.font = parseInt(props.height / 2) + 'px';
        // (text,x,y)文字内容、绘制的其实位置
        context.fillText(props.desc, 5, props.height * 0.7);
    }
};
</script>


 6233
6233


 被折叠的 条评论
为什么被折叠?
被折叠的 条评论
为什么被折叠?
 到【灌水乐园】发言


