


文章目录
前言
最近有个需求,Prometeus要监控业务系统的运行时指标和业务指标,用来做数据分析和报表。运行时指标包括系统使用的cpu,内存,创建的goroutie等。业务指标包括数据库连接状态,Redis连接状态,IPFS连接状态,平台收入,平台支出及其他业务指标等。
根据技术调研,gin框架默认支持与prometheus集成,会生成go运行时的metrics,也可以自定义metrics,下面来看下具体例子和业务应用。
一、gin添加go运行时metrics
1. 创建一个gin server
// 这里我集成了pprof与业务端口相区分
func newPProfServer() *http.Server {
	r := gin.New()
	pprof.Register(r) //注册pprof
	sysMetric(r) // 创建路由

	srv := &http.Server{
		Addr:    fmt.Sprintf("%s:%d", config.ApplicationConfig.Host, 9123),
		Handler: r,
	}
	go func() {
		// 服务连接
		if config.SslConfig.Enable {
			if err := srv.ListenAndServeTLS(config.SslConfig.Pem, config.SslConfig.KeyStr); err != nil && err != http.ErrServerClosed {
				logger.Fatal("listen: ", err)
			}
		} else {
			if err := srv.ListenAndServe(); err != nil && err != http.ErrServerClosed {
				logger.Fatal("listen: ", err)
			}
		}
	}()

	fmt.Println(utils.Green("Server pprof run at:"))
	fmt.Printf("-  Local:   http://%s:%d/debug/pprof/ \r\n", utils.GetLocaHonst(), 9123)

	return srv
}

// 关闭pprof server
func closePProfServer(pprofServer *http.Server, ctx context.Context) {
	if err := pprofServer.Shutdown(ctx); err != nil {
		logger.Warnf("PProf Server Shutdown:", err)
	} else {
		logger.Info("PProf Server exited!")
	}
}
2. 创建一个metrics的路由
func sysMetric(r *gin.Engine) {
	r.GET("/metrics", middleware.GinWrapper(promhttp.Handler()))
}
3. 启动服务
func startServer() {
	var pprofServer *http.Server
	pprofServer = newPProfServer() // 启动pprof

	quit := make(chan os.Signal)
	signal.Notify(quit, os.Interrupt)
	<-quit
	fmt.Printf("%s Shutdown Server ... \r\n", utils.GetCurrentTimeStr())

	ctx, cancel := context.WithTimeout(context.Background(), 5*time.Second)
	defer cancel()

	closePProfServer(pprofServer, ctx) //关闭pprof

	select {
	case <-ctx.Done():
		fmt.Println("timeout of 5 seconds.")
		return
	default:
		return
	}
}
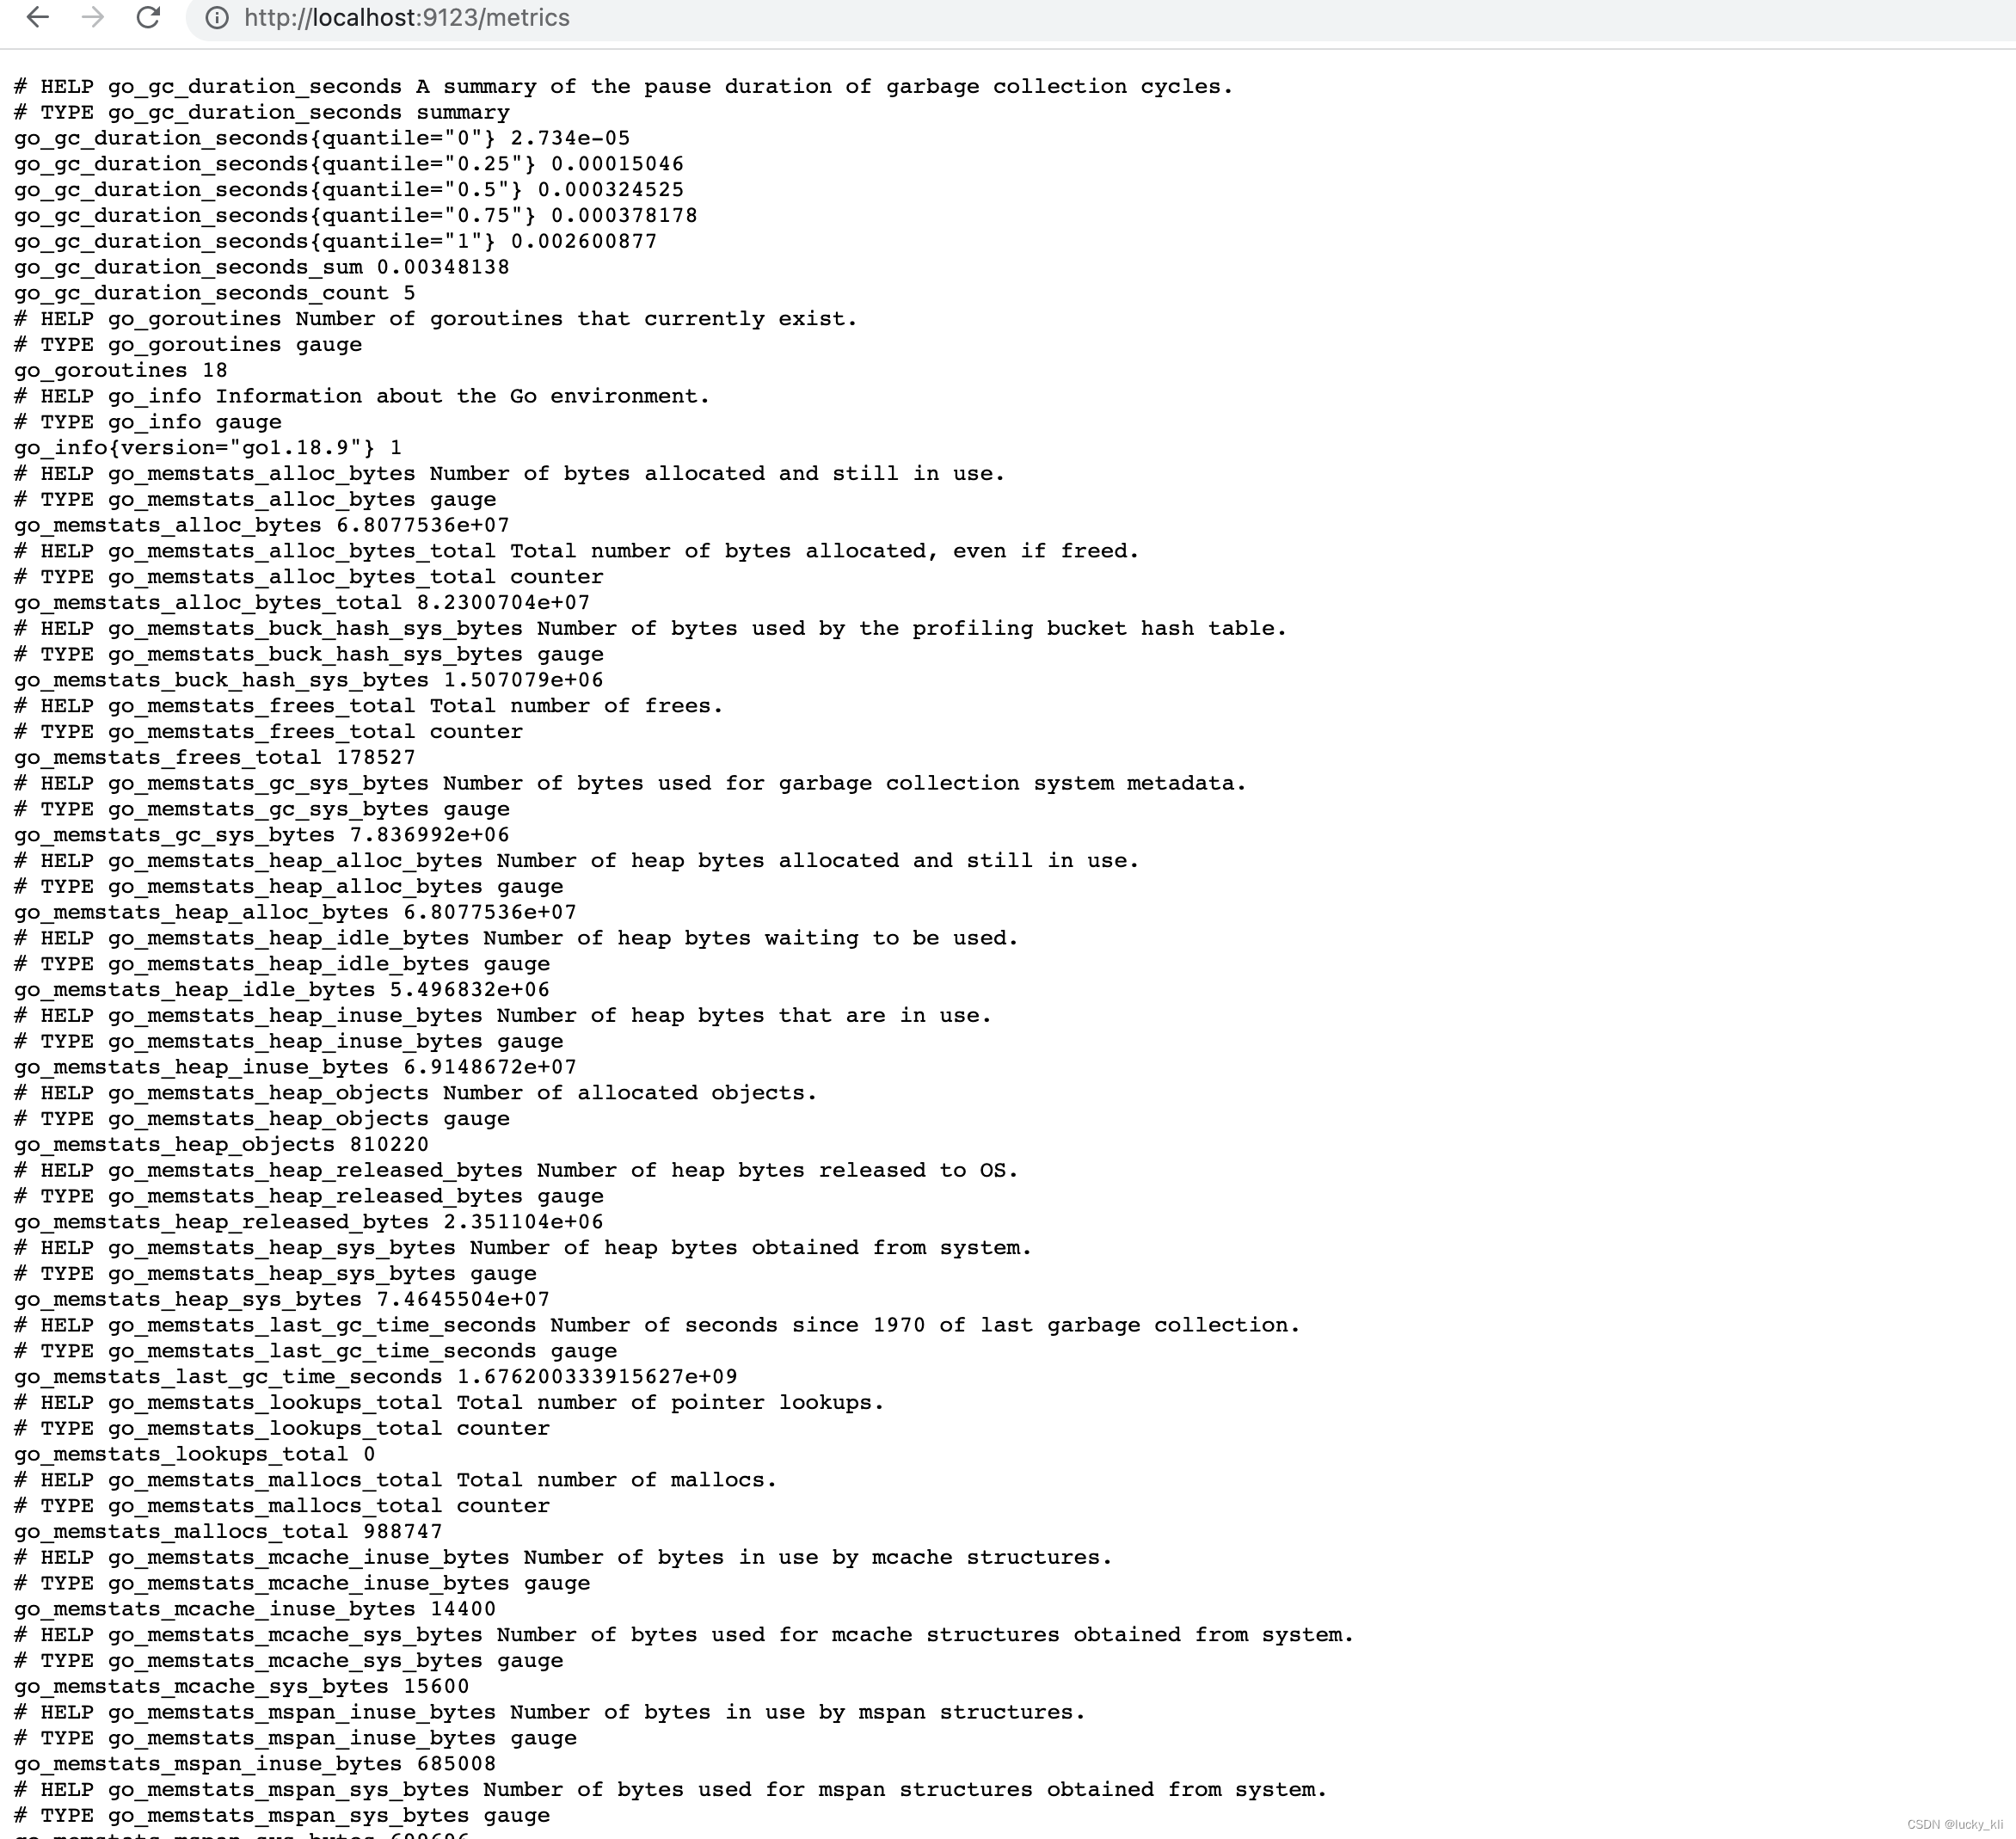
4. 查看结果
metrics页面
http://localhost:9123/metrics
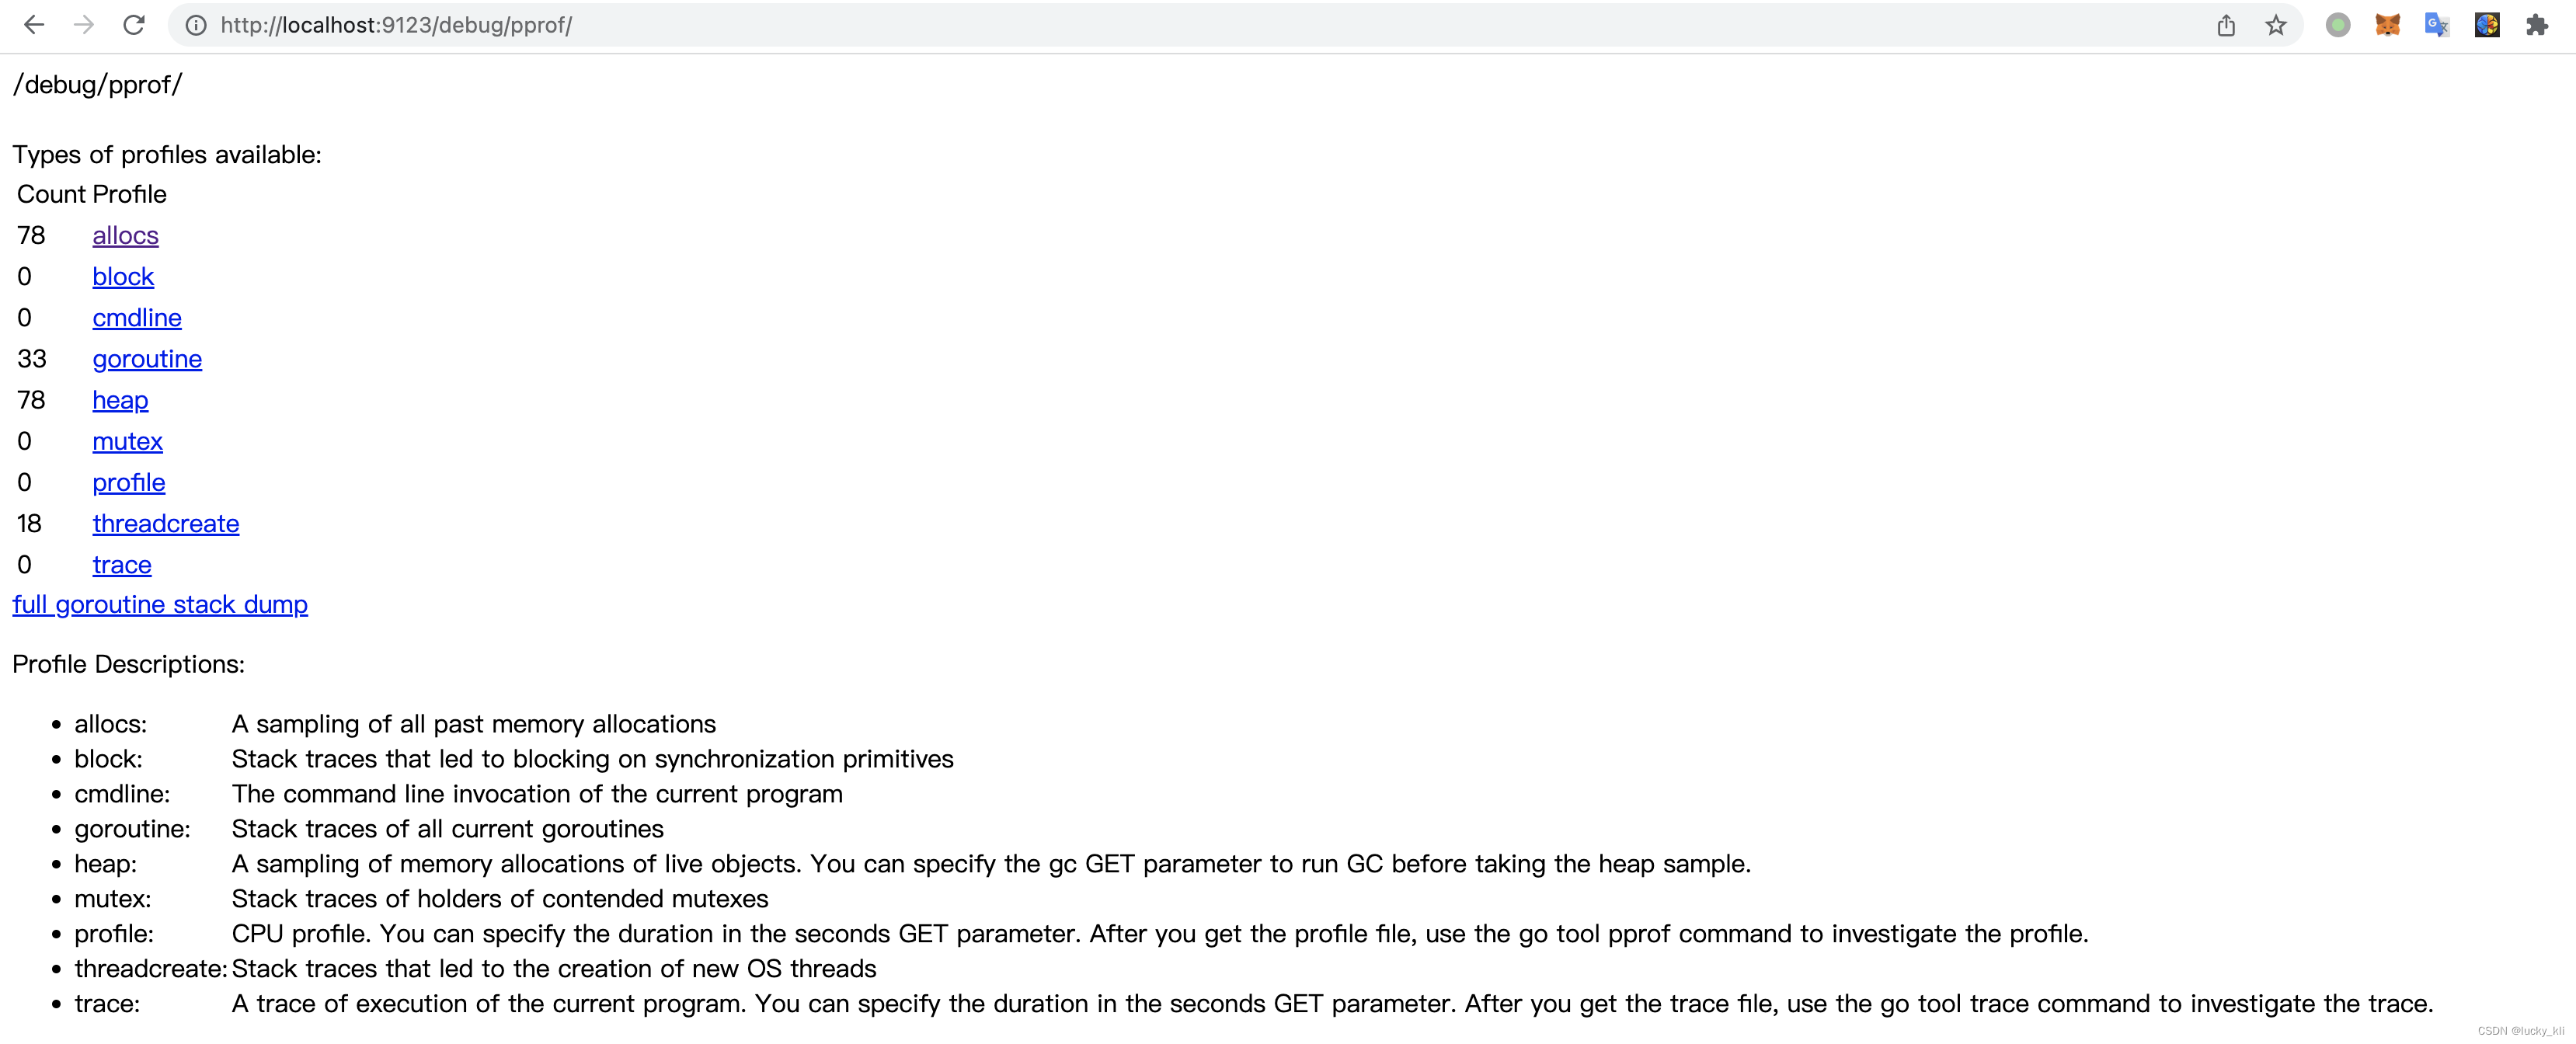
pprof页面
http://localhost:9123/debug/pprof/
二、gin自定义应用程序metrics
官方库示例
- https://pkg.go.dev/github.com/prometheus/client_golang/prometheus@v1.14.0#hdr-A_Basic_Example
package main

import (
	"log"
	"net/http"

	"github.com/prometheus/client_golang/prometheus"
	"github.com/prometheus/client_golang/prometheus/promhttp"
)

type metrics struct {
	cpuTemp  prometheus.Gauge
  hdFailures *prometheus.CounterVec
}

func NewMetrics(reg prometheus.Registerer) *metrics {
  m := &metrics{
    cpuTemp: prometheus.NewGauge(prometheus.GaugeOpts{
      Name: "cpu_temperature_celsius",
      Help: "Current temperature of the CPU.",
    }),
    hdFailures: prometheus.NewCounterVec(
      prometheus.CounterOpts{
        Name: "hd_errors_total",
        Help: "Number of hard-disk errors.",
      },
      []string{"device"},
    ),
  }
  reg.MustRegister(m.cpuTemp)
  reg.MustRegister(m.hdFailures)
  return m
}

func main() {
  // Create a non-global registry.
  reg := prometheus.NewRegistry()

  // Create new metrics and register them using the custom registry.
  m := NewMetrics(reg)
  // Set values for the new created metrics.
	m.cpuTemp.Set(65.3)
	m.hdFailures.With(prometheus.Labels{"device":"/dev/sda"}).Inc()

	// Expose metrics and custom registry via an HTTP server
	// using the HandleFor function. "/metrics" is the usual endpoint for that.
	http.Handle("/metrics", promhttp.HandlerFor(reg, promhttp.HandlerOpts{Registry: reg}))
	log.Fatal(http.ListenAndServe(":8080", nil))
}
注意
在官方示例中,m.cpuTemp.Set(65.3)是设置一个定值,但是监控指标肯定是一个动态值,每次prometheus每次获取的数据指标都是不同的,所以这个获取指标的频次和获取方式是需要考虑的。比如用corn定时来设置指标数据,或者起一个goroutine 一直去刷指标数据来设置,这个要看各家的需求。我使用的是corn的方式来设置指标,下面是业务案例。
三、定时更新应用程序metrics
设计
- 启动一个独立端口,来监控应用程序metrics
- 定时获取指标数据
- 便于扩展其他业务指标
指标
- mysql连接状态
- redis连接状态
- ipfs连接状态
代码
这里只示例一个ipfs的指标。
IPFS
package third_party

import (
	"context"
	"github.com/prometheus/client_golang/prometheus"
	"internal/admin/service/ipfs"
	"sync"
)

var ipfsMetric *IpfsMetrics
var ipfsOnce sync.Once

type IpfsMetrics struct {
	ipfsConnectedStatus prometheus.Gauge
}

// IpfsConnectedStatusSet 设置ipfs连接状态
func (i *IpfsMetrics) IpfsConnectedStatusSet() {
	client, err := ipfs.New(ipfs.GenIpfsOpts()).DefaultClient()
	if err != nil {
		i.ipfsConnectedStatus.Set(0)
		return
	}
	if _, err = client.Version(context.TODO()); err != nil {
		i.ipfsConnectedStatus.Set(0)
	} else {
		i.ipfsConnectedStatus.Set(1)
	}
}

func NewIpfsMetrics(reg prometheus.Registerer) *IpfsMetrics {
	ipfsOnce.Do(func() {
		ipfsMetric = &IpfsMetrics{
			ipfsConnectedStatus: prometheus.NewGauge(prometheus.GaugeOpts{
				Name: "ipfs_connected_status",
				Help: "Check whether the current connection status of ipfs in the service is normal.0:abnormal;1:normal",
			}),
		}
		reg.MustRegister(ipfsMetric.ipfsConnectedStatus)
	})
	return ipfsMetric
}
Task
统一管理定时任务获取指标
package monitor

import (
	"github.com/kingwel-xie/k2/core/logger"
	"github.com/prometheus/client_golang/prometheus"
	"github.com/robfig/cron/v3"
	"internal/admin/monitor/third_party"
	"os"
	"os/signal"
)

func printLog(cronJob string, err error) {
	if err != nil {
		logger.Errorf("Start %s Error, err: %v", cronJob, err)
	} else {
		logger.Infof("Start %s Successful!", cronJob)
	}
}

func ipfsJob(spec string, c *cron.Cron, reg prometheus.Registerer) {
	_, err := c.AddFunc(spec, func() {
		third_party.NewIpfsMetrics(reg).IpfsConnectedStatusSet()
	})
	printLog("ipfs monitor", err)
}

func mysqlJob(spec string, c *cron.Cron, reg prometheus.Registerer) {
	_, err := c.AddFunc(spec, func() {
		third_party.NewMysqlMetrics(reg).MysqlConnectedStatusSet()
	})
	printLog("mysql monitor", err)
}

func redisJob(spec string, c *cron.Cron, reg prometheus.Registerer) {
	_, err := c.AddFunc(spec, func() {
		third_party.NewRedisMetrics(reg).RedisConnectedStatusSet()
	})
	printLog("redis monitor", err)
}

//定时任务
// 0 * * * * ? 每1分钟触发一次
// 0 0 * * * ? 每天每1小时触发一次
// 0 0 10 * * ? 每天10点触发一次
// 0 * 14 * * ? 在每天下午2点到下午2:59期间的每1分钟触发
// 0 30 9 1 * ? 每月1号上午9点半
// 0 15 10 15 * ? 每月15日上午10:15触发
// */5 * * * * ? 每隔5秒执行一次
// 0 */1 * * * ? 每隔1分钟执行一次
// 0 0 5-15 * * ? 每天5-15点整点触发
// 0 0/3 * * * ? 每三分钟触发一次
// 0 0 0 1 * ?  每月1号凌晨执行一次
func execScheduled(reg prometheus.Registerer) {
	c := cron.New(cron.WithSeconds())
	spec := "0 */1 * * * ?"

	ipfsJob(spec, c, reg)
	mysqlJob(spec, c, reg)
	redisJob(spec, c, reg)

	c.Start()

	quit := make(chan os.Signal)
	signal.Notify(quit, os.Interrupt)
	<-quit
	c.Stop()
	logger.Info("Monitor Scheduled Job Stopped!")
}
Metrics
用新的prometheus注册器来收集指标
package monitor

import (
	"github.com/prometheus/client_golang/prometheus"
	"github.com/prometheus/client_golang/prometheus/promhttp"
	"net/http"
)

//创建prometheus注册器
func newRegisterer() *prometheus.Registry {
	reg := prometheus.NewRegistry()
	go execScheduled(reg) //启动任务
	return reg
}

//Prometheus中间件
func PrometheusHandler() http.Handler {
	reg := newRegisterer()
	return promhttp.HandlerForTransactional(prometheus.ToTransactionalGatherer(reg), promhttp.HandlerOpts{Registry: reg})
}
启动服务
启动服务pprof、monitor服务
func startServer() {
	var pprofServer *http.Server
	var monitorServer *http.Server

	pprofServer = newPProfServer() // 启动pprof
	monitorServer = newMonitorServer() //启动监控server

	quit := make(chan os.Signal)
	signal.Notify(quit, os.Interrupt)
	<-quit
	fmt.Printf("%s Shutdown Server ... \r\n", utils.GetCurrentTimeStr())

	ctx, cancel := context.WithTimeout(context.Background(), 5*time.Second)
	defer cancel()

	closeMonitorServer(monitorServer, ctx) //关闭monitor
	closePProfServer(pprofServer, ctx) //关闭pprof

	select {
	case <-ctx.Done():
		fmt.Println("timeout of 5 seconds.")
		return
	default:
		return
	}
}
创建monitor服务
func newMonitorServer() *http.Server {
	r := gin.New()
	appMetric(r)

	srv := &http.Server{
		Addr:    fmt.Sprintf("%s:%d", config.ApplicationConfig.Host, 9124),
		Handler: r,
	}
	go func() {
		// 服务连接
		if config.SslConfig.Enable {
			if err := srv.ListenAndServeTLS(config.SslConfig.Pem, config.SslConfig.KeyStr); err != nil && err != http.ErrServerClosed {
				logger.Fatal("listen: ", err)
			}
		} else {
			if err := srv.ListenAndServe(); err != nil && err != http.ErrServerClosed {
				logger.Fatal("listen: ", err)
			}
		}
	}()

	fmt.Println(utils.Green("Monitor Server run at:"))
	fmt.Printf("-  Local:   http://%s:%d/metrics/ \r\n", utils.GetLocaHonst(), 9124)

	return srv
}

func appMetric(r *gin.Engine) {
	r.GET("/metrics", middleware.GinWrapper(monitor.PrometheusHandler())) //使用上面的中间件即可
}

//关闭monitor服务
func closeMonitorServer(pprofServer *http.Server, ctx context.Context) {
	if err := pprofServer.Shutdown(ctx); err != nil {
		logger.Warnf("Monitor Server Shutdown:", err)
	} else {
		logger.Info("Monitor Server exited!")
	}
}
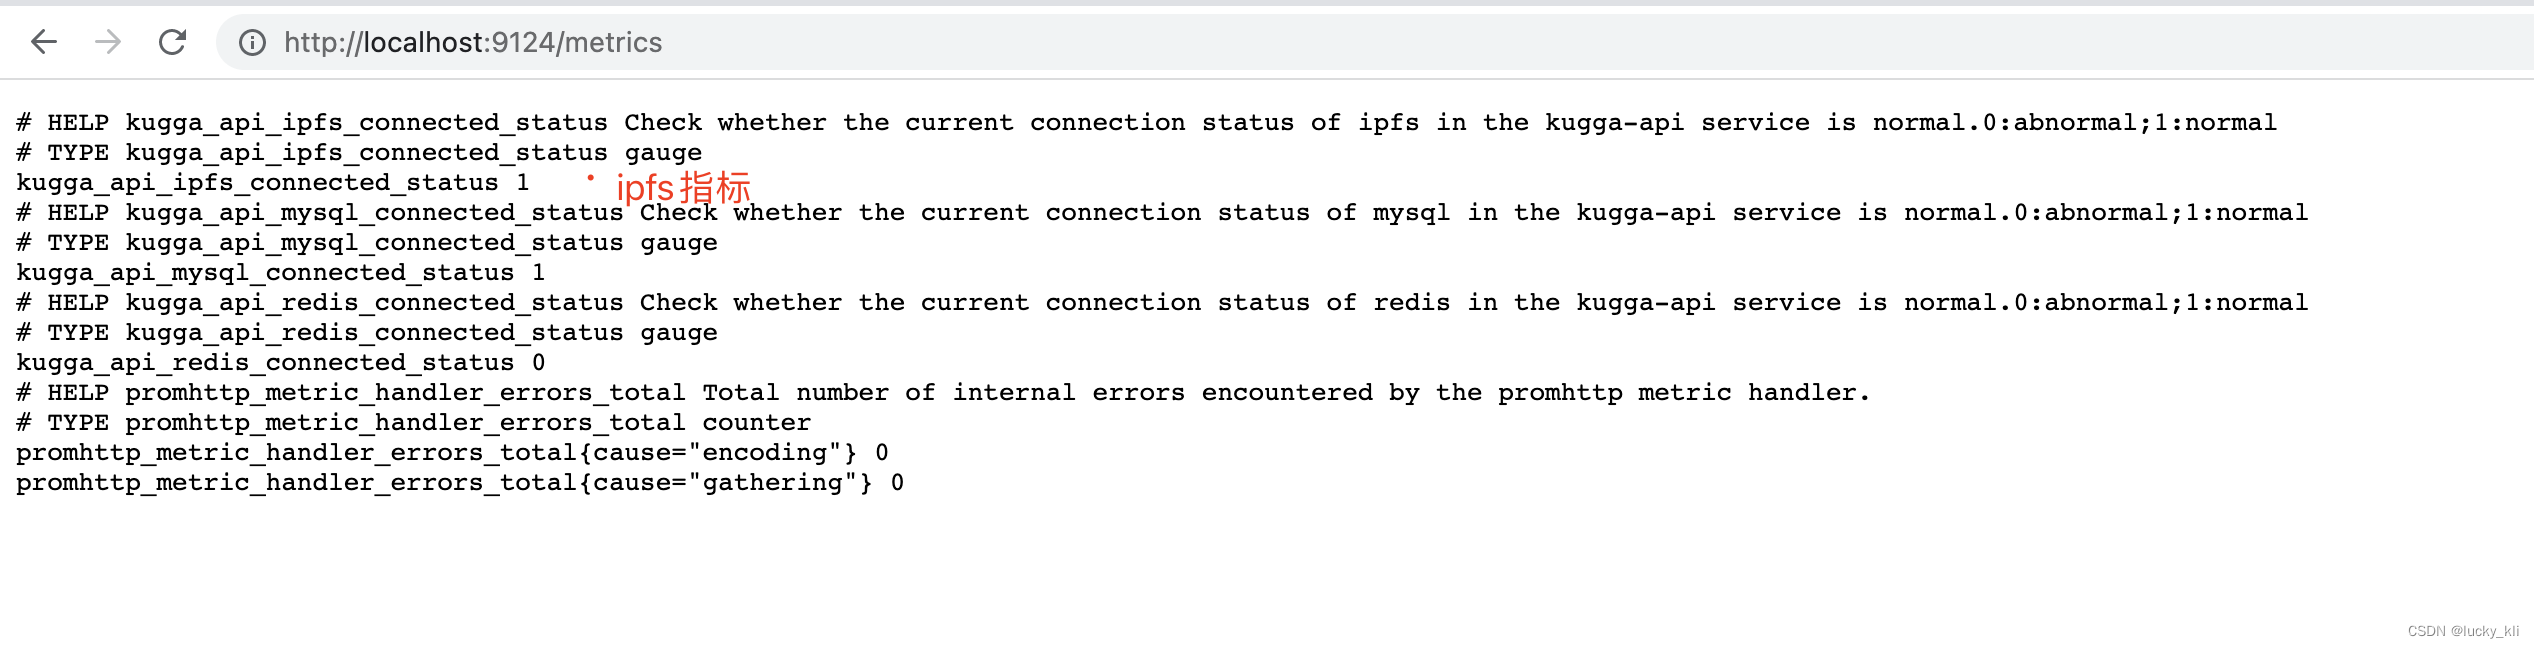
查看页面
http://localhost:9124/metrics
总结
Prometheus监控应用程序指标在日常开发中很常见,gin框架集成prometheus也非常好,容易自定义,可以根据不同业务场景,来使用不同的收集方式。下面整理了用到的库和官方地址。
- go第三方库使用示例:
- https://pkg.go.dev/github.com/prometheus/client_golang/prometheus@v1.14.0#hdr-A_Basic_Example
- prometheus/client_golang
- https://github.com/prometheus/client_golang/


 1597
1597


 被折叠的 条评论
为什么被折叠?
被折叠的 条评论
为什么被折叠?
 到【灌水乐园】发言


