


参考文章: Android Native层(C++)内存泄露诊断,Google debug malloc官方文档
1. dumpsys meminfo 某个进程
Applications Memory Usage (in Kilobytes):
Uptime: 1813572 Realtime: 5359997

** MEMINFO in pid 31628 [com.android.contacts] **
                   Pss  Private  Private     Swap      Rss     Heap     Heap     Heap
                 Total    Dirty    Clean    Dirty    Total     Size    Alloc     Free
                ------   ------   ------   ------   ------   ------   ------   ------
  Native Heap    31084    30972        0        0    39872    47136    44592     2543
  Dalvik Heap    20187    20072        0        0    29100    27338     6835    20503
 Dalvik Other     1988     1964        0        0     4320
        Stack     1584     1584        0        0     1596
       Ashmem       26        0        0        0     1716
      Gfx dev     2484     2484        0        0     2488
    Other dev       29        0       24        0      520
     .so mmap     2970      400        0        0    56820
    .jar mmap     1058        0       16        0    34296
    .apk mmap     7711       36     4208        0    15896
    .ttf mmap     2357        0      520        0    16328
    .dex mmap    17738       60    16536        0    19852
    .oat mmap      395        0        0        0    13824
    .art mmap     5775     5496       44        0    24176
   Other mmap       74        8        4        0     1512
   EGL mtrack    41104    41104        0        0    41104
    GL mtrack     3100     3100        0        0     3100
      Unknown      744      740        0        0     1732
        TOTAL   140408   108020    21352        0   308252    74474    51427    23046

 Unknown Details
       Linker      250      248        0        0      496
    .bss mmap      338      336        0        0      872
   libc alloc      120      120        0        0      224
     libc use       32       32        0        0      120
 Unnamed data        4        4        0        0        4
       Others        0        0        0        0       16

 App Summary
                       Pss(KB)                        Rss(KB)
                        ------                         ------
           Java Heap:    25612                          53276
         Native Heap:    30972                          39872
                Code:    21776                         157080
               Stack:     1584                           1596
            Graphics:    46688                          46692
       Private Other:     2740
              System:    11036
             Unknown:                                    9736

           TOTAL PSS:   140408            TOTAL RSS:   308252      TOTAL SWAP (KB):        0

 Objects
               Views:      286         ViewRootImpl:        1
         AppContexts:        8           Activities:        1
              Assets:       29        AssetManagers:        0
       Local Binders:       58        Proxy Binders:       60
       Parcel memory:       16         Parcel count:       67
    Death Recipients:        8      OpenSSL Sockets:        0
            WebViews:        0

 SQL
         MEMORY_USED:        0
  PAGECACHE_OVERFLOW:        0          MALLOC_SIZE:        0
2. 单抓native heap dump
先设置属性:
1. Collect a native heap dump from the device. For example:
   $ adb shell stop
   $ adb shell setprop libc.debug.malloc.program app_process
   $ adb shell setprop libc.debug.malloc.options backtrace=64   # 默认是16
   $ adb shell start
    (launch and use app)
然后启动app并使用,然后抓dump信息:
   $ adb shell am dumpheap -n <pid> /data/local/tmp/native_heap.txt
   $ adb pull /data/local/tmp/native_heap.txt
3. 用native_heapdump_viewer.py分析
工具获取方法:
去google android源代码中找
/development/scripts/native_heapdump_viewer.py
将native_heap.txt文件上传到编译平台,通过native_heapdump_viewer.py脚本解析该文件。这个脚本的大致原理呢其实就是利用addr2line将Sysmbol表与我们dunp下来的地址进行map比对,同时呢计算出每个so库所分配的内存资源。
$ python native_heapdump_viewer.py [options] native_heap.txt
      [--verbose]: verbose output
      [--html]: interactive html output
      [--reverse]: reverse the backtraces (start the tree from the leaves)
      [--symbols SYMBOL_DIR] SYMBOL_DIR is the directory containing the .so files with symbols.
                 Defaults to $ANDROID_PRODUCT_OUT/symbols
      [--app-symbols SYMBOL_DIR] SYMBOL_DIR is the directory containing the app APK and so files.
                 Defaults to the current directory.
   This outputs a file with lines of the form:

      5831776  29.09% 100.00%    10532     71b07bc0b0 /system/lib64/libandroid_runtime.so Typeface_createFromArray frameworks/base/core/jni/android/graphics/Typeface.cpp:68

   5831776 is the total number of bytes allocated at this stack frame, which
   is 29.09% of the total number of bytes allocated and 100.00% of the parent
   frame's bytes allocated. 10532 is the total number of allocations at this
   stack frame. 71b07bc0b0 is the address of the stack frame.
执行脚本:
python native_heapdump_viewer.py /home/mi/native_heap.txt > heap_info.txt
注意: native_heap.txt需要绝对路径。因为我不在编译平台上解析,所以不能带参数,否则会失败。如果在编译平台上,那可以带–symbols参数。
4. 分析结果展示
Resolving symbols using directory ./symbols...
...
/apex/com.android.vndk.v33/lib64/libgralloctypes.so not found for symbol resolution
/apex/com.android.art/lib64/libperfetto_hprof.so not found for symbol resolution
/vendor/lib64/vendor.qti.hardware.display.mapper@2.0.so not found for symbol resolution
/apex/com.android.art/lib64/libart.so not found for symbol resolution

    BYTES %TOTAL %PARENT    COUNT    ADDR LIBRARY FUNCTION LOCATION
 21613961 100.00%  69.81%    57922 APP
  3769048  17.44%  17.44%       97   7e3f8519fc /system/lib64/libhwui.so ??? ???
  3769040  17.44% 100.00%       96     7e3f853268 /system/lib64/libhwui.so ??? ???
  3769040  17.44% 100.00%       96       7e5c95d1e0 /system/lib64/libft2.so ??? ???
  3760128  17.40%  99.76%       48         7e5c99ce48 /system/lib64/libft2.so ??? ???
  3759616  17.39%  99.99%       16           7e5c99da58 /system/lib64/libft2.so ??? ???
  3759616  17.39% 100.00%       16             7e5c952d6c /system/lib64/libft2.so ??? ???
  3759616  17.39% 100.00%       16               7e3f85e6c8 /system/lib64/libhwui.so ??? ???
  3759616  17.39% 100.00%       16                 7e4b090110 /apex/com.android.runtime/lib64/bionic/libc.so ??? ???
      384   0.00%   0.01%       16           7e5c99dc14 /system/lib64/libft2.so ??? ???
      ...
上面可以看到会提示"not found for symbol resolution",这是因为我们执行解析命令的时候不在编译平台上,找不到.symbol文件导致的。所以想要能输出具体的调用函数的调用栈,需要保证有.symbol文件。
5. showmap
这里附带一些额外的关于内存诊断的一些小工具与小知识,Android平台自身还有一些工具,如showmap、procrank工具,编译后存在于以下目录:system/xbin/ showmap与system/xbin/procrank
showmap使用方法:
spm8666p1_64_car:/ # showmap –help

unrecognized argument: –help

showmap [-t] [-v] [-c] [-q] <pid>

        -t = terse (show only items with private pages)

        -v = verbose (don’t coalesce maps with the same name)

        -a = addresses (show virtual memory map)

        -q = quiet (don’t show error if map could not be read)
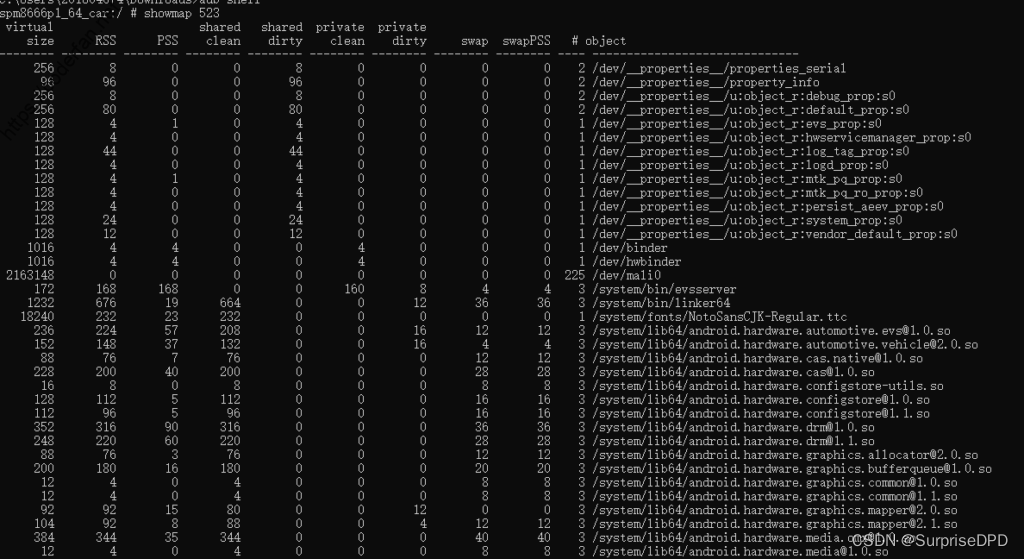
showmap可以将特定进程下的各个so库的资源占用情况进行查询显示,这对排查内存泄露问题还是有很大帮助的,如下图所示:
记录下Android性能分析工具链接:Android性能专项测试


 2057
2057


 被折叠的 条评论
为什么被折叠?
被折叠的 条评论
为什么被折叠?
 到【灌水乐园】发言


