


一、监控linux服务器
在需要被监控的服务器上安装node_exporter
安装步骤详见第一步
修改prometheus 配置文件
- targets: ["192.168.134.132:9100"]
labels:
instance: test主服务器
[root@rabbitmq_2 prometheus]# curl -X POST http://localhost:9090/-/reload
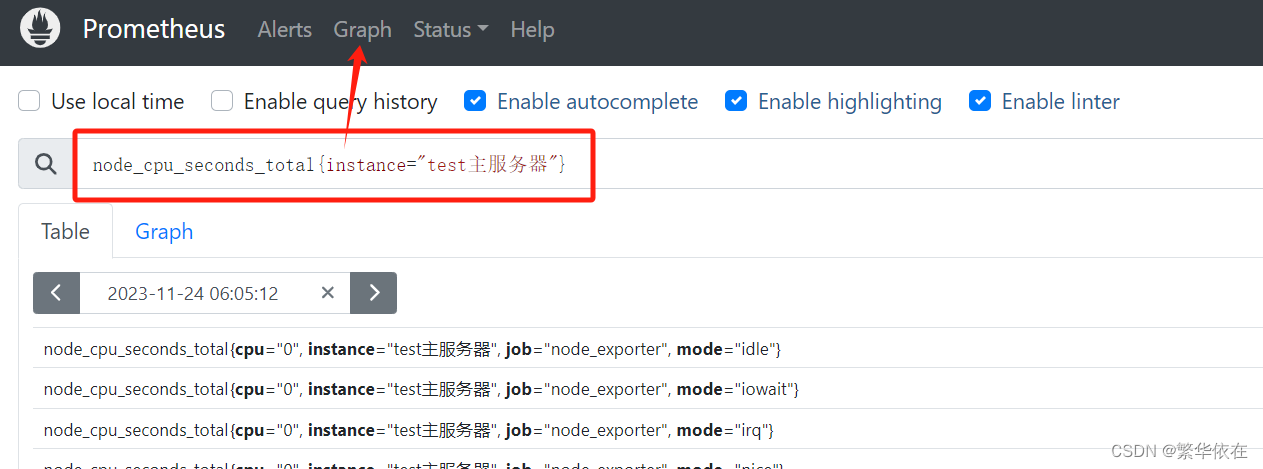
重新加载即可二、监控CPU
node_cpu_seconds_total{instance="test主服务器"}
如果想查看1分钟的负载 :node_load1
5分钟的负载可以使用:node_load5
三、监控mysql服务
下载mysql_exporter
https://github.com/prometheus/mysqld_exporter/releases/download/v0.15.0/mysqld_exporter-0.15.0.linux-amd64.tar.gz
解压并修改下mingcheng
[root@rabbitmq_1 prometheus]# tar -zxvf mysqld_exporter-0.15.0.linux-amd64.tar.gz
[root@rabbitmq_1 prometheus]# mv mysqld_exporter-0.15.0.linux-amd64 mysqld_exporter
在同目录下 新建配置文件
[root@rabbitmq_1 mysqld_exporter]# vim my.cnf
[client]
user=root
password=123456
host=192.168.134.132
port=3306

使用systemctl启动
[root@rabbitmq_1 system]# vim mysqld_exporter.service
[Unit]
Description=Prometheus Mysqld Exporter
Documentation=https://prometheus.io/
After=network.target

[Service]
Type=simple
User=prometheus
Group=prometheus
Restart=always
ExecStart=/opt/prometheus/mysqld_exporter/mysqld_exporter \
--config.my-cnf=/opt/prometheus/mysqld_exporter/my.cnf \
--collect.global_status \
--collect.auto_increment.columns \
--collect.info_schema.processlist \
--collect.binlog_size \
--collect.info_schema.tablestats \
--collect.global_variables \
--collect.info_schema.innodb_metrics \
--collect.info_schema.query_response_time \
--collect.info_schema.userstats \
--collect.info_schema.tables \
--collect.perf_schema.tablelocks \
--collect.perf_schema.file_events \
--collect.perf_schema.eventswaits \
--collect.perf_schema.indexiowaits \
--collect.perf_schema.tableiowaits \
--collect.slave_status \
--web.listen-address=0.0.0.0:9104

[Install]
WantedBy=multi-user.target

参数详解:
--config.my-cnf:指定MySQL配置文件路径。为mysqld_exporter提供了连接MySQL数据库的必要信息。
--collect.global_status:收集MySQL实例全局状态信息,如打开的连接数、读写操作次数等。
--collect.auto_increment.columns:收集所有表自增列的当前值。
--collect.info_schema.processlist:收集MySQL实例中正在运行的进程列表信息。
--collect.binlog_size:收集MySQL二进制日志文件大小信息。
--collect.info_schema.tablestats:收集所有表的统计信息。

--collect.global_variables:收集MySQL实例中全局变量的值。
--collect.info_schema.innodb_metrics:收集InnoDB存储引擎的性能指标信息。
--collect.info_schema.query_response_time:收集所有查询的响应时间信息。
--collect.info_schema.userstats:收集所有用户的统计信息。
--collect.info_schema.tables:收集所有表的详细信息。

--collect.perf_schema.tablelocks:收集MySQL锁的信息。

--collect.perf_schema.file_events:收集所有文件事件的信息。
--collect.perf_schema.eventswaits:收集事件等待的信息。
--collect.perf_schema.indexiowaits:收集索引IO等待的信息。

--collect.perf_schema.tableiowaits:收集表IO等待的信息。
--collect.slave_status:收集MySQL复制状态信息。
--web.listen-address:指定mysqld_exporter监听的地址和端口,用于提供Web接口。

启动
[root@rabbitmq_1 system]# systemctl start mysqld_exporter.service
[root@rabbitmq_1 system]#

[root@rabbitmq_1 system]# systemctl status mysqld_exporter.service

web访问
http://192.168.134.132:9104/metrics

修改Prometheus 配置文件,用来采集mysqld 数据
[root@rabbitmq_2 prometheus]# vim prometheus.yml
  # node_exporter配置
  - job_name: "node_exporter"
    scrape_interval: 15s
    static_configs:
    - targets: ["localhost:9100"]
      labels:
        instance: Prometheus服务器

    - targets: ["192.168.134.132:9100"]
      labels:
        instance: test主服务器

  - job_name: "mysqld_exporter"
    static_configs:
    - targets: ["192.168.134.132:9104"]
      labels:
        instance: mysql服务
常用监控指标
mysql_up :服务是否在线
mysql_global_status_*:这些指标参数提供了MySQL实例的全局状态信息,如连接数、查询次数等。
    常用的有:
    mysql_global_status_up:运行时长 s
    mysql_global_status_threads_connected:当前客户端的连接数。
    mysql_global_variables_max_connections:允许的最大连接数
    mysql_global_status_threads_running:正在执行命令的客户端连接数


mysql_global_status_queries:执行过的查询次数。
    mysql_global_status_slow_queries:慢查询次数。

mysql_global_status_bytes_received:接收到的字节数。

mysql_global_status_bytes_sent:发送的字节数。

mysql_info_schema_*:这些指标参数提供了关于MySQL信息模式(information schema)的统计信息。
    常用的有:
    mysql_info_schema_table_rows:表中的行数。
    mysql_info_schema_table_open_cache_hits:表缓存命中次数。
    mysql_info_schema_table_open_cache_misses:表缓存未命中次数。

mysql_info_schema_table_locks_waited:等待表锁的次数。

mysql_info_schema_table_locks_immediate:立即获得表锁的次数。
mysql_perf_schema_*:这些指标参数提供了MySQL性能模式(performance schema)的统计信息。
    常用的有:
    mysql_perf_schema_file_summary_by_event_name_count_read:读取文件的次数。

mysql_perf_schema_file_summary_by_event_name_count_write:写入文件的次数。

mysql_perf_schema_events_waits_summary_global_by_event_name_count:事件等待的次数。

mysql_perf_schema_table_io_waits_summary_by_index_usage_count_read:索引读取等待的次数。

mysql_perf_schema_table_io_waits_summary_by_index_usage_count_write:索引写入等待的次数。

mysql_slave_status_*:这些指标参数提供了MySQL复制状态的信息。
    常用的有:
    mysql_slave_status_seconds_behind_master:从主服务器延迟的时间(秒)。
    mysql_slave_status_slave_io_running:Slave_IO线程是否正在运行。
    mysql_slave_status_slave_sql_running:Slave_SQL线程是否正在运行。
mysql_auto_increment_*:这些指标参数提供了所有表自增列的当前值。
    常用的有:

mysql_auto_increment_max:自增列的最大值。
    mysql_auto_increment_reset:自增列的重置次数。

mysql_query_response_time_*:这些指标参数提供了查询的响应时间信息。
    常用的有:

mysql_query_response_time_count:查询的总数。

mysql_query_response_time_sum:查询的总时间。
    mysql_query_response_time_quantile:查询响应时间的分位数。
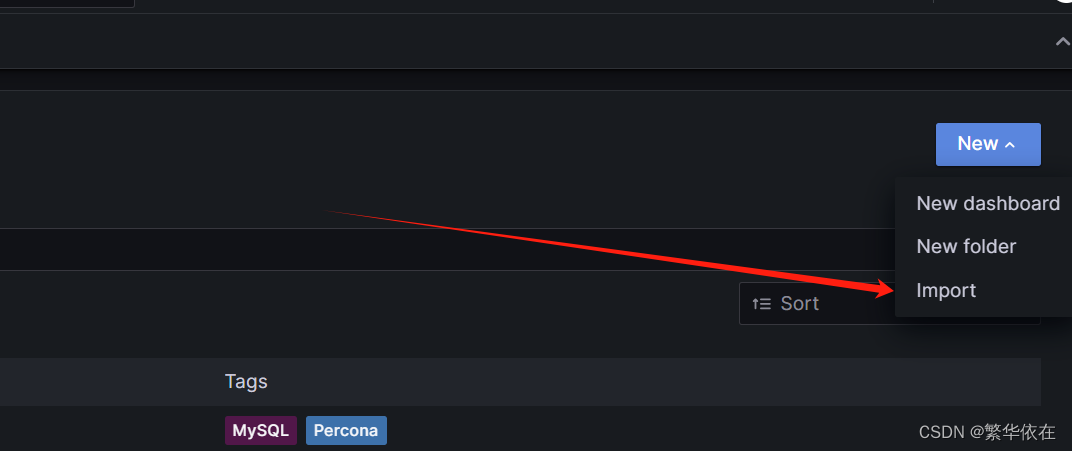
通过grafana监控mysql
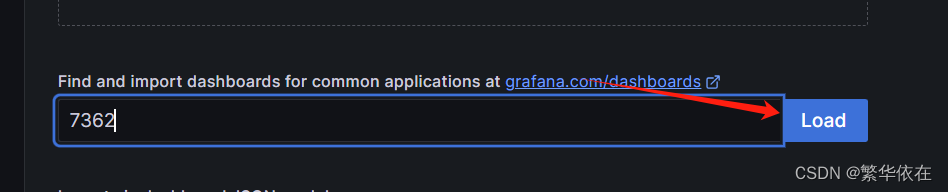
然后就好了


 1万+
1万+


 被折叠的 条评论
为什么被折叠?
被折叠的 条评论
为什么被折叠?
 到【灌水乐园】发言


