


记录项目中使用echarts仪表盘的使用
先上设计稿
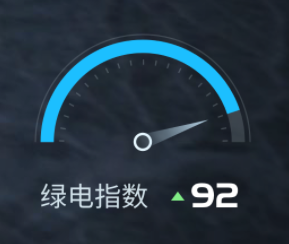
我们要实现这样的仪表盘我用的echarts版本是5.1.2。
项目中option配置:
import * as echarts from 'echarts';

let option = {
	series: [
      {
        type: "gauge",
        // center: ["50%", "60%"], // 仪表位置
        radius: "100%", //仪表大小
        startAngle: 180, //开始角度
        endAngle: 0, //结束角度
        axisLine: {
          show: true,
          lineStyle: {
            // 属性lineStyle控制线条样式
            color: [[1, "rgba(230, 247, 255, .16)"]],
            width: 1,
          },
        },
        splitLine: {
          show: false,
        },
        axisTick: {
          show: false,
        },
        axisLabel: {
          show: false,
        },
        pointer: {
          show: false,
        },
        detail: {
          show: false,
        },
      },
      {
        type: "gauge",
        // center: ["50%", "45%"], // 默认全局居中
        radius: "95%",
        startAngle: 180, //开始角度
        endAngle: 0, //结束角度
        splitNumber: 5,
        progress: {
          show: true,
          itemStyle: {
            color: "rgba(28, 191, 255, 1)",
          },
        },
        axisLine: {
          show: true,
          lineStyle: {
            // 属性lineStyle控制线条样式
            color: [
              //表盘颜色
              [1, "rgba(230, 247, 255, .16)"],
            ],
            width: 10, //表盘宽度
          },
        },
        splitLine: {
          show: false,
        },
        axisTick: {
          //刻度线样式(及短线样式)
          length: 6,
          distance: 2,
        },
        axisLabel: {
          //文字样式(及“10”、“20”等文字样式)
          show: false,
        },
        detail: {
          show: false,
        },
        // 表盘指针中间的固定点
        anchor: {
          show: true,
          showAbove: true,
          size: fontSize(2),
          itemStyle: {
            color: "rgba(230, 247, 255, 0.06)",
            borderColor: "rgba(230, 247, 255, 1)",
            borderWidth: fontSize(14),
          },
        },
        //	指针样式
        itemStyle: {
          color: new echarts.graphic.LinearGradient(0, 0, 0, 1, [
            { offset: 0, color: "rgba(188, 218, 236, 1)" },
            { offset: 1, color: "rgba(188, 218, 236, 0)" },
          ]),
        },
        data: [
          {
            value: 56,
            label: {
              textStyle: {
                fontSize: 12,
              },
            },
          },
        ],
      },
    ]
 }
重点配置就是anchor和itemStyle这俩个,因为我这个主要是要按我设计稿的样式调整指针,至于说为什么我的一个仪表盘里series有俩个值那是因为我对于仪表盘外边框的还原采用了仪表盘堆叠的方式。接下来看我实现的样式
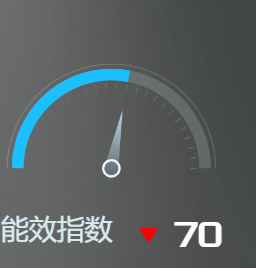
对于这块内容的样式基本一直,剩余的可以自己调整。更多的配置在
链接: echarts配置项.


 8890
8890


 被折叠的 条评论
为什么被折叠?
被折叠的 条评论
为什么被折叠?
 到【灌水乐园】发言


