


一.安装nagios_oracle_health插件
1.查看perl包有没有安装。
[root@DB02 ~]# rpm -qa|grep perl
perl-Test-Simple-0.92-136.el6.x86_64
perl-ExtUtils-MakeMaker-6.55-136.el6.x86_64
perl-version-0.77-136.el6.x86_64
perl-ExtUtils-ParseXS-2.2003.0-136.el6.x86_64
perl-libs-5.10.1-136.el6.x86_64
perl-5.10.1-136.el6.x86_64
perl-CGI-3.51-136.el6.x86_64
perl-devel-5.10.1-136.el6.x86_64
perl-Pod-Escapes-1.04-136.el6.x86_64
perl-Pod-Simple-3.13-136.el6.x86_64
perl-Test-Harness-3.17-136.el6.x86_64
perl-Module-Pluggable-3.90-136.el6.x86_64
[root@DB02 ~]# perl -v
This is perl, v5.10.1 (*) built for x86_64-linux-thread-multi
Copyright 1987-2009, Larry Wall
Perl may be copied only under the terms of either the Artistic License or the
GNU General Public License, which may be found in the Perl 5 source kit.
Complete documentation for Perl, including FAQ lists, should be found on
this system using "man perl" or "perldoc perl". If you have access to the
Internet, point your browser athttp://www.perl.org/, the Perl Home Page.
从执行上面的两个命令好,可以看到perl包安装正常
2.安装DBI
tar -zxvf DBI-1.636.tar.gz
cd DBI-1.636
perl Makefile.PL
make all
make install
3.安装DBD-Oracle
tar -zxvf DBD-Oracle-1.74.tar.gz
cd DBD-Oracle-1.74
perlMakefile.PL
执行命令报错如下:
[root@DB01 DBD-Oracle-1.74]# perl Makefile.PL
Multiple copies of Driver.xst found in: /usr/local/lib64/perl5/auto/DBI/ /usr/lib64/perl5/auto/DBI/ at Makefile.PL line 39
Using DBI 1.636 (for perl 5.010001 on x86_64-linux-thread-multi) installed in /usr/local/lib64/perl5/auto/DBI/
Configuring DBD::Oracle for perl 5.010001 on linux (x86_64-linux-thread-multi)
Remember to actually *READ* the README file! Especially if you have any problems.
Trying to find an ORACLE_HOME
Your LD_LIBRARY_PATH env var is set to ''
The ORACLE_HOME environment variable is not set and I couldn't guess it.
It must be set to hold the path to an Oracle installation directory
on this machine (or a machine with a compatible architecture).
See the appropriate README file for your OS for more information.
ABORTED!
解决方法:在root的bash_profile里面添加下面的代码#这里是现网的数据库的环境变量的配置
ORACLE_BASE=/u01/oracle/app
ORACLE_HOME=$ORACLE_BASE/product/11g/dbhome_1
ORACLE_SID=kdzfw
LD_LIBRARY_PATH=$ORACLE_HOME/lib
PATH=$PATH:$ORACLE_HOME/bin:$HOME/bin:$ORACLE_HOME/OPatch
export ORACLE_BASE ORACLE_HOME ORACLE_SID LD_LIBRARY_PATH PATH
source .bash_profile
重新执行命令perl Makefile.PL
make all
make install
登录数据库,建个nagios帐号,并授予一些权限。
create user nagios identified by oradbmon;grant create session to nagios;grant select any dictionary to nagios;grant select on V_$SYSSTAT to nagios;grant select on V_$INSTANCE to nagios;grant select on V_$LOG to nagios;grant select on SYS.DBA_DATA_FILES to nagios;grant select on SYS.DBA_FREE_SPACE to nagios;
4.安装check_oracle_health
tar -zxvf check_oracle_health-2.1.3.5.tar.gz
cd check_oracle_health-2.1.3.5
./configure --prefix=/usr/local/nagios --with-nagios-user=nagios --with-nagios-group=nagios --with-mymodules-dir=/usr/local/nagios/libexec --with-mymodules-dyn-dir=/usr/local/nagios/libexec
make all
make install
5.使用oracle用户运行测试脚本:如下的输出说明插件工作正常。
./check_oracle_health --connect=orcl --username=nagios--password= oradbmon--mode=tnsping
OK - connection established to orcl.
6.把oracle下面的环境变量复制到root下的bash_profile里面,并执行source bash_profile使配置立即生效。
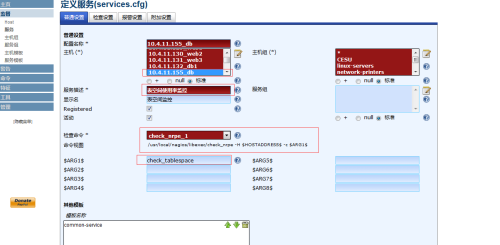
7.在被监控机上定义一个服务,监控表空间,在客户机的nrpe.cfg里配置监控命令。
command[check_tablespace]=/usr/local/nagios/libexec/check_oracle_health --connect kdzfw --username nagios --password oradbmon --warning 95 --critical 98 --mode tablespace-usage
注意:把nrpe.cfg配置文件里的dont_blame_nrpe=1,允许命令后可以带一些参数。
使用脚本在本地测试使用脚本监控表空间,显示正常,如下所示:
[oracle@DB01 libexec]$ /usr/local/nagios/libexec/check_oracle_health --connect kdzfw --username nagios --password oradbmon --warning 95 --critical 98 --mode tablespace-usage
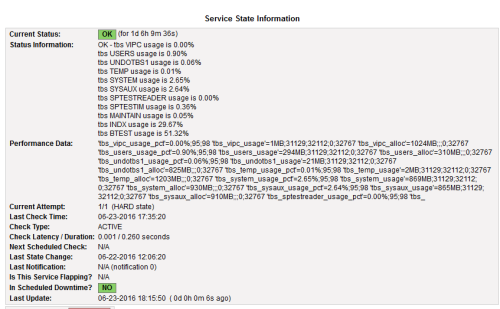
OK - tbs VIPC usage is 0.00%, tbs USERS usage is 0.90%, tbs UNDOTBS1 usage is 0.05%, tbs TEMP usage is 0.01%, tbs SYSTEM usage is 2.65%, tbs SYSAUX usage is 2.65%, tbs SPTESTREADER usage is 0.00%, tbs SPTESTIM usage is 0.36%, tbs MAINTAIN usage is 0.05%, tbs INDX usage is 29.67%, tbs BTEST usage is 51.32% | 'tbs_vipc_usage_pct'=0.00%;95;98 'tbs_vipc_usage'=1MB;31129;32112;0;32767 'tbs_vipc_alloc'=1024MB;;;0;32767 'tbs_users_usage_pct'=0.90%;95;98 'tbs_users_usage'=294MB;31129;32112;0;32767 'tbs_users_alloc'=310MB;;;0;32767 'tbs_undotbs1_usage_pct'=0.05%;95;98 'tbs_undotbs1_usage'=16MB;31129;32112;0;32767 'tbs_undotbs1_alloc'=825MB;;;0;32767 'tbs_temp_usage_pct'=0.01%;95;98 'tbs_temp_usage'=2MB;31129;32112;0;32767 'tbs_temp_alloc'=1203MB;;;0;32767 'tbs_system_usage_pct'=2.65%;95;98 'tbs_system_usage'=869MB;31129;32112;0;32767 'tbs_system_alloc'=930MB;;;0;32767 'tbs_sysaux_usage_pct'=2.65%;95;98 'tbs_sysaux_usage'=867MB;31129;32112;0;32767 'tbs_sysaux_alloc'=920MB;;;0;32767 'tbs_sptestreader_usage_pct'=0.00%;95;98 'tbs_sptestreader_usage'=1MB;31129;32112;0;32767 'tbs_sptestreader_alloc'=1024MB;;;0;32767 'tbs_sptestim_usage_pct'=0.36%;95;98 'tbs_sptestim_usage'=119MB;31129;32112;0;32767 'tbs_sptestim_alloc'=1024MB;;;0;32767 'tbs_maintain_usage_pct'=0.05%;95;98 'tbs_maintain_usage'=1MB;1945;2007;0;2048 'tbs_maintain_alloc'=1024MB;;;0;2048 'tbs_indx_usage_pct'=29.67%;95;98 'tbs_indx_usage'=9721MB;31129;32112;0;32767 'tbs_indx_alloc'=11024MB;;;0;32767 'tbs_btest_usage_pct'=51.32%;95;98 'tbs_btest_usage'=50451MB;93388;96337;0;98303 'tbs_btest_alloc'=71680MB;;;0;98303
8.服务端使用的是nagiosql管理工具,在里面配置相应的服务。
9.nagios展示的效果:

二.安装check_linux_stats.pl脚本
1.先安装perl-UNIVERSAL-require-0.13-1.el6.rf.noarch.rpm,这里是rpm包。
[root@DB02 huaxia]# rpm -ivh perl-UNIVERSAL-require-0.13-1.el6.rf.noarch.rpm
warning: perl-UNIVERSAL-require-0.13-1.el6.rf.noarch.rpm: Header V3 DSA/SHA1 Signature, key ID 6b8d79e6: NOKEY
Preparing... ########################################### [100%]
1:perl-UNIVERSAL-require ########################################### [100%]
[root@DB02 huaxia]# rpm -qa|grep perl-UNIVERSAL-require
perl-UNIVERSAL-require-0.13-1.el6.rf.noarch
2.安装Sys-Statistics-Linux
tar -zxvf Sys-Statistics-Linux-0.66.tar.gz
cd Sys-Statistics-Linux-0.66
[root@DB02 Sys-Statistics-Linux-0.66]# perl Makefile.PL
Checking if your kit is complete...
Looks good
Warning: prerequisite Time::HiRes 0 not found.#报错!
Writing Makefile for Sys::Statistics::Linux
解决方法:yum -y install perl-Time-HiRes
重新执行:
[root@DB02 Sys-Statistics-Linux-0.66]# perl Makefile.PL
Writing Makefile for Sys::Statistics::Linux
make all
make install
3.下载check_linux_stats.pl监控脚本,并把脚本放到/usr/local/nagios/libexec的插件目录里
执行./check_linux_stats.pl,可以看到该脚本可以监控很多参数。
[oracle@DB02 libexec]$ ./check_linux_stats.pl --help
check_linux_stats v1.3.1
Usage: ./check_linux_stats.pl -C|-P|-M|-N|-D|-I|-L|-F|-S|-W|-U -p -w -c [-s ] [-u ] [-V] [-h]
-h, --help
print this help message
-C, --cpu=CPU USAGE
-P, --procs
-M, --memory=MEMORY USAGE
-N, --network=NETWORK USAGE
-D, --disk=DISK USAGE
-I, --io=DISK IO USAGE
-L, --load=LOAD AVERAGE
-F, --file=FILE STATS
-S, --socket=SOCKET STATS
-W, --paging=PAGING AND SWAPPING STATS
-U, --uptime
-p, --pattern
eth0,eth1...sda1,sda2.../usr,/tmp
-w, --warning
-c, --critical
-s, --sleep
-u, --unit
%, KB, MB or GB left on disk usage, default : MB
REQS OR BYTES on disk io statistics, default : REQS
-V, --version
version number
ex :
Memory usage : perl check_linux_stats.pl -M -w 90 -c 95
Cpu usage : perl check_linux_stats.pl -C -w 90 -c 95 -s 5
Disk usage : perl check_linux_stats.pl -D -w 95 -c 100 -u % -p /tmp,/usr,/var
Load average : perl check_linux_stats.pl -L -w 10,8,5 -c 20,18,15
Paging statistics : perl check_linux_stats.pl -W -w 10,1000 -c 20,2000 -s 3
Process statistics : perl check_linux_stats.pl -P -w 100 -c 200
I/O statistics on disk device : perl check_linux_stats.pl -I -w 10 -c 5 -p sda1,sda4,sda5,sda6
Network usage : perl check_linux_stats.pl -N -w 10000 -c 100000000 -p eth0
Processes virtual memory : perl check_linux_stats.pl -T -w 9551820 -c 9551890 -p /var/run/sendmail.pid
Uptime : perl check_linux_stats.pl -U -w 5
[oracle@DB02 libexec]$ ./check_linux_stats.pl -M -w 90 -c 95#测试了下内存,显示正常。
MEMORY CRITICAL : Mem used: 97.96%, Swap used: 0.96% |MemUsed=97.96%;90;95 SwapUsed=0.96;; MemCached=91.65 SwapCached=0.21 Active=60.85
4.在客户机的nrpe.cfg里面加入几项监控的服务。
command[check_HA_servhamachine]=/usr/local/nagios/libexec/check_procs -w $ARG1$ -c $ARG2$ -C $ARG3$
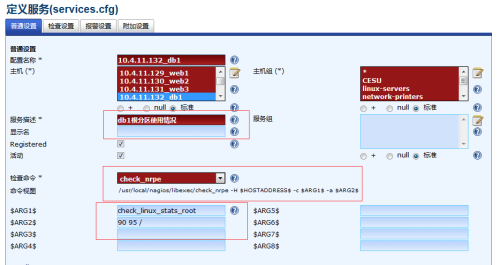
command[check_linux_stats_root]=/usr/local/nagios/libexec/check_linux_stats.pl -D -w $ARG1$ -c $ARG2$ -p $ARG3$
command[check_linux_stats_load]=/usr/local/nagios/libexec/check_linux_stats.pl -L -w $ARG1$ -c $ARG2$
command[check_linux_stats_cpu]=/usr/local/nagios/libexec/check_linux_stats.pl -C -w $ARG1$ -c $ARG2$ -s $ARG3$
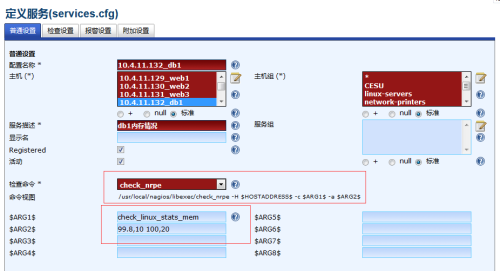
command[check_linux_stats_mem]=/usr/local/nagios/libexec/check_linux_stats.pl -M -w $ARG1$ -c $ARG2$
5.服务器端用的是nagiosql,在里面把这几个监控项加一下。


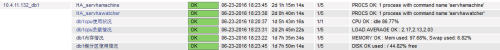
6.nagios服务端的展示效果。


 2916
2916


 被折叠的 条评论
为什么被折叠?
被折叠的 条评论
为什么被折叠?
 到【灌水乐园】发言


