


1)下载和启动node_exporter
wget https://github.com/prometheus/node_exporter/releases/download/v0.16.0/node_exporter-0.16.0.linux-amd64.tar.gz
tar xf node_exporter-0.16.0.linux-amd64.tar.gz
cd node_exporter-0.16.0.linux-amd64
./node_exporter
2)node_exporter 启动之后,我们访问下 /metrics 接口看看是否能正常获取服务器指标:
curl http://localhost:9100/metrics
3)修改prometheus配置文件
scrape_configs:
- job_name: 'server'
static_configs:
- targets: ['192.168.1.42:9100']

重启服务: ./prometheus --config.file=prometheus.yml
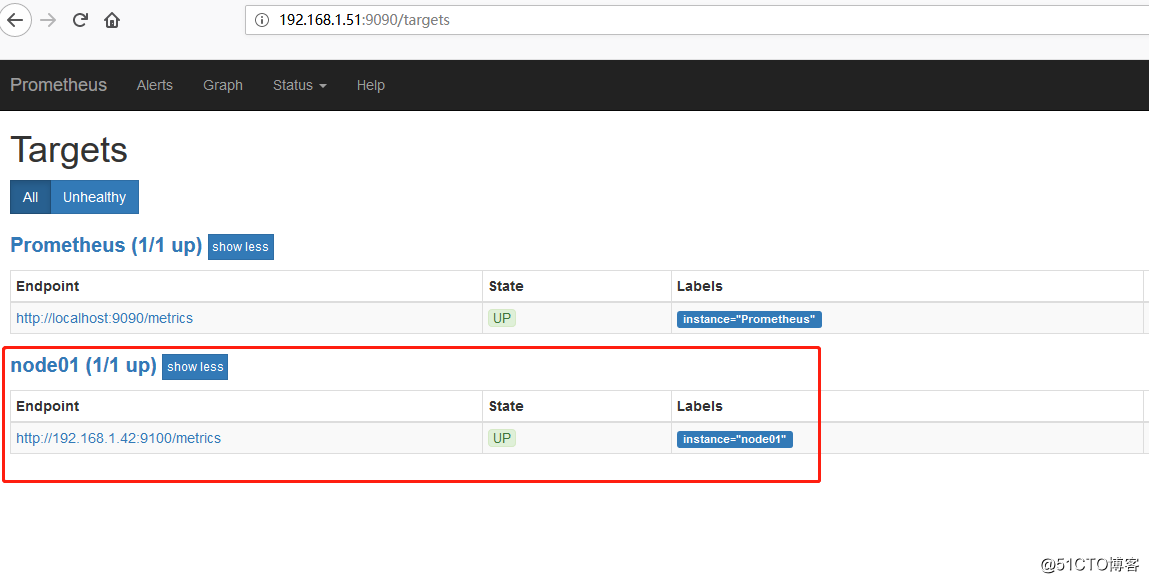
4)在 Prometheus Web UI 的 Status -> Targets 中,可以看到新加的服务器
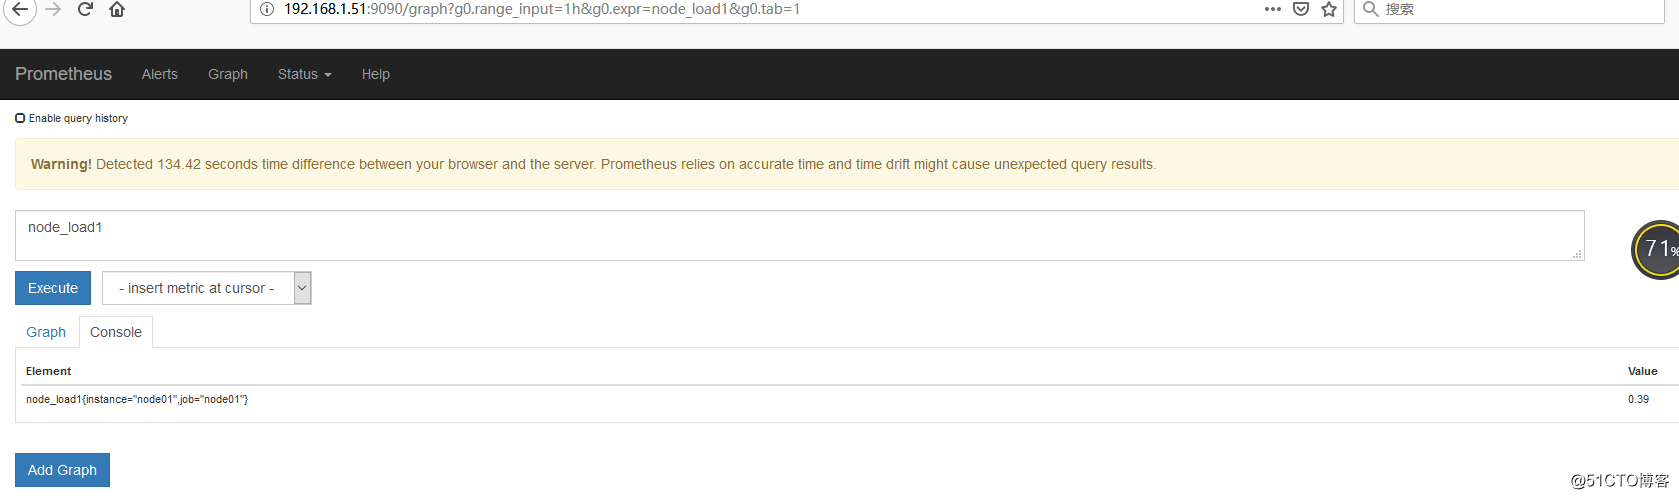
5)查询数据验证
6)下载grafana的服务器指标模板
https://grafana.com/dashboards 页面搜索node exporter
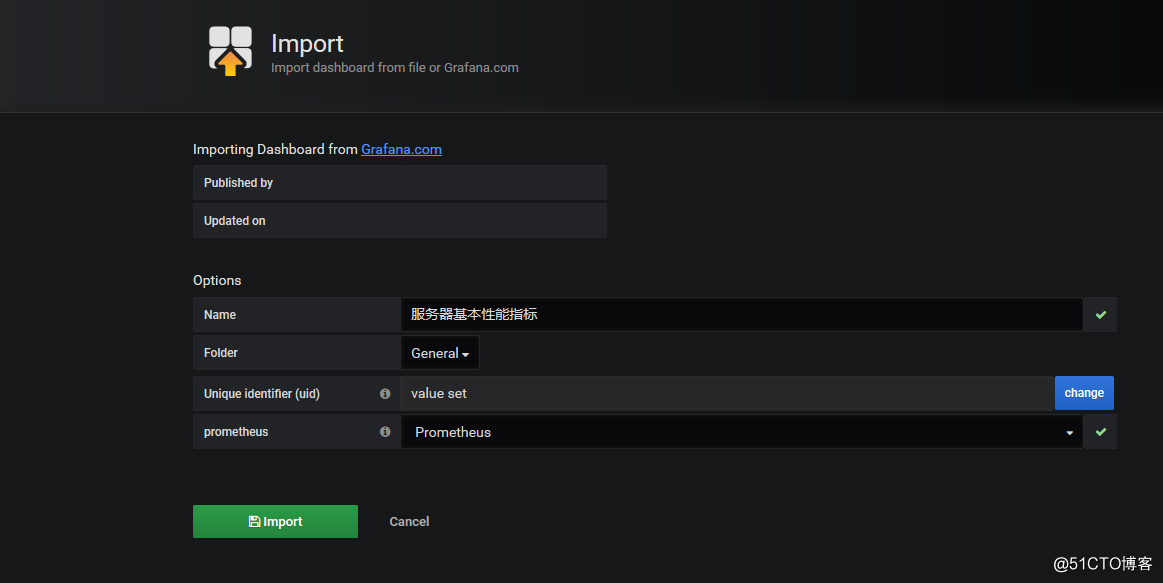
7)导入模板
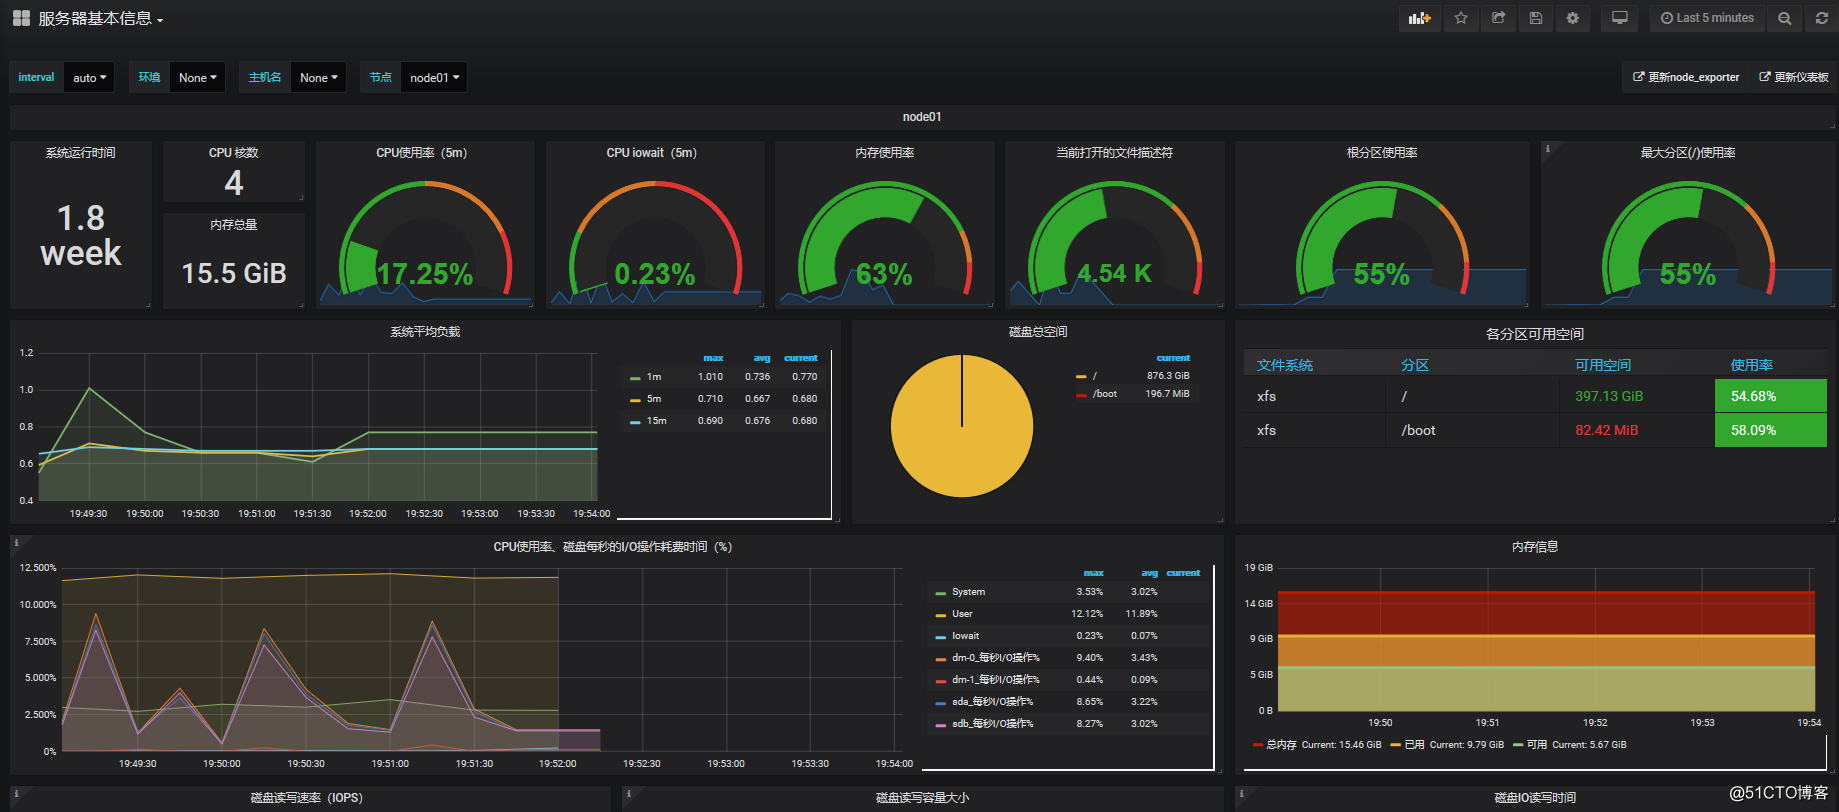
8)查看效果
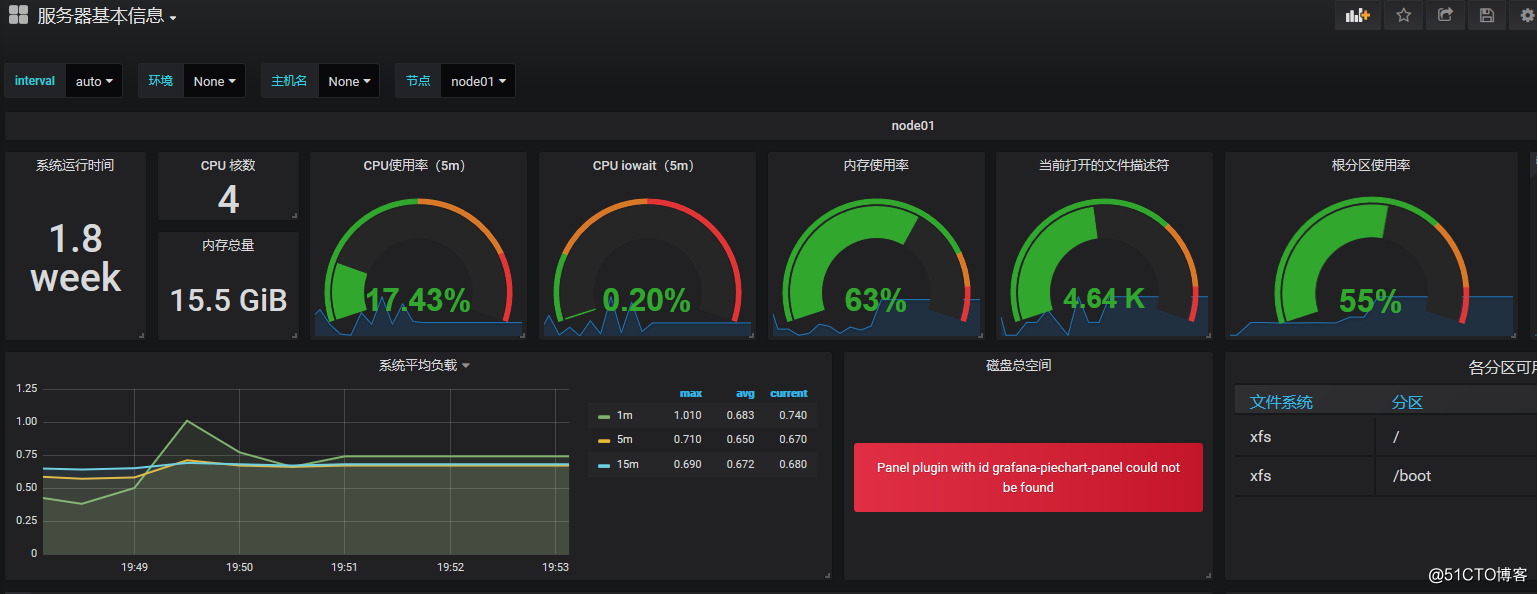
9)安装饼图插件
grafana-cli plugins install grafana-piechart-panel
systemctl restart grafana-server
10)再次刷新


 3168
3168


 被折叠的 条评论
为什么被折叠?
被折叠的 条评论
为什么被折叠?
 到【灌水乐园】发言


