


 本文利用美国华盛顿共享单车租赁数据,通过数据探索、预处理、建模(岭回归、Lasso回归、线性回归),对租赁需求进行预测。数据表明,季节、天气、工作日等因素对租赁数量有显著影响,其中岭回归模型表现最优。
前言
现如今,共享单车在生活中可谓处处可见,那么它的租赁需求是多少呢?今天我们就基于美国华盛顿共享单车的租赁数据,对租赁需求进行预测。
目录
正文
1. 数据来源及背景
数据背景: 该数据集是美国华盛顿共享单车租赁数据, 其中有训练集和测试集, 在训练集中包含10886个样本以及12个字段, 通过训练集上自行车租赁数据对美国华盛顿共享单车租赁需求进行预测.
2. 数据探索分析
1. 读取数据
importpandas as pd
df= pd.read_csv(r'D:\Data\bike.csv')
pd.set_option('display.max_rows',4)
df
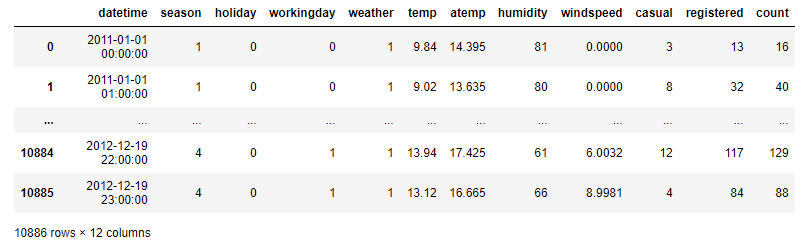
通过以上可以得知数据维度10886行X12列, 除了第一列其它均显示为数值, 具体的格式还要进一步查看, 对于各列的解释也放入下一环节.
2. 查看数据整体信息
df.info()
RangeIndex: 10886 entries, 0 to 10885
Data columns (total 12 columns):
datetime 10886 non-null object #时间和日期
season 10886 non-null int64 #季节, 1 =春季,2 =夏季,3 =秋季,4 =冬季
holiday 10886 non-null int64 #是否是假期, 1=是, 0=否
workingday 10886 non-null int64 #是否是工作日, 1=是, 0=否
weather 10886 non-null int64 #天气,1:晴朗,很少有云,部分多云,部分多云; 2:雾+多云,雾+碎云,雾+少云,雾; 3:小雪,小雨+雷雨+散云,小雨+散云; 4:大雨+冰块+雷暴+雾,雪+雾
temp 10886 non-null float64 #温度
atemp 10886 non-null float64 #体感温度
humidity 10886 non-null int64 #相对湿度
windspeed 10886 non-null float64 #风速
casual 10886 non-null int64 #未注册用户租赁数量
registered 10886 non-null int64 #注册用户租赁数量
count 10886 non-null int64 #所有用户租赁总数
dtypes: float64(3), int64(8), object(1)memory usage: 1020.6+ KB
除了datetime为字符串型, 其他均为数值型, 且无缺失值.
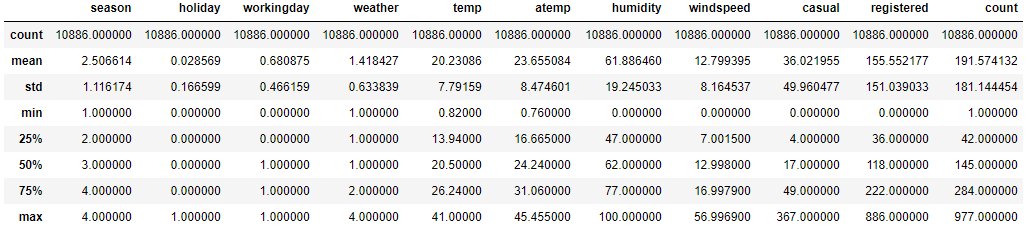
3. 描述性统计
df.describe()
温度, 体表温度, 相对湿度, 风速均近似对称分布, 而非注册用户, 注册用户,以及总数均右偏分布.
4. 偏态, 峰态
for i in range(5, 12):
name=df.columns[i]print('{0}偏态系数为 {1}, 峰态系数为 {2}'.format(name, df[name].skew(), df[name].kurt()))
temp偏态系数为 0.003690844422472008, 峰态系数为 -0.9145302637630794
atemp偏态系数为 -0.10255951346908665, 峰态系数为 -0.8500756471754651
humidity偏态系数为 -0.08633518364548581, 峰态系数为 -0.7598175375208864
windspeed偏态系数为 0.5887665265853944, 峰态系数为 0.6301328693364932
casual偏态系数为 2.4957483979812567, 峰态系数为 7.551629305632764
registered偏态系数为 1.5248045868182296, 峰态系数为 2.6260809999210672
count偏态系数为 1.2420662117180776, 峰态系数为 1.3000929518398334
temp, atemp, humidity低度偏态, windspeed中度偏态, casual, registered, count高度偏态
temp, atemp, humidity为平峰分布, windspeed,casual, registered, count为尖峰分布.
3. 数据预处理
由于没有缺失值, 不用处理缺失值, 看看有没有重复值.
1. 检查重复值
print('未去重:', df.shape)print('去重:', df.drop_duplicates().shape)
未去重: (10886, 12)
去重: (10886, 12)
没有重复项, 看看异常值.
2. 异常值
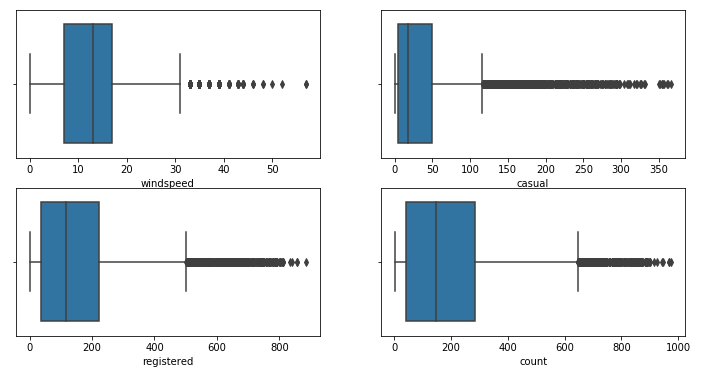
通过箱线图查看异常值
importseaborn as snsimportmatplotlib.pyplot as plt
fig, axes= plt.subplots(nrows=2, ncols=2, figsize=(12, 6))#绘制箱线图
sns.boxplot(x="windspeed", data=df,ax=axes[0][0])
sns.boxplot(x='casual', data=df, ax=axes[0][1])
sns.boxplot(x='registered', data=df, ax=axes[1][0])
sns.boxplot(x='count', data=df, ax=axes[1][1])
plt.show()
租赁数量会受小时的影响, 比如说上班高峰期等, 故在这里先不处理异常值.
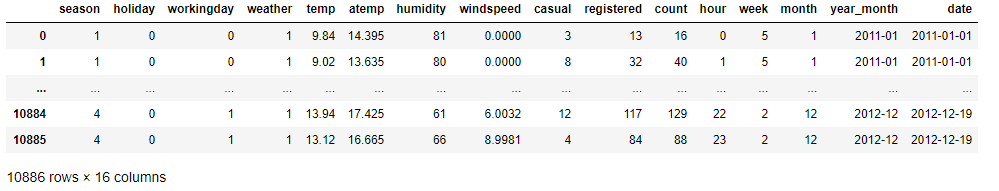
3. 数据加工
转换"时间和日期"的格式, 并提取出小时, 日, 月, 年.
#转换格式, 并提取出小时, 星期几, 月份
df['datetime'] = pd.to_datetime(df['datetime'])
df['hour'] =df.datetime.dt.hour
df['week'] =df.datetime.dt.dayofweek
df['month'] =df.datetime.dt.month
df['year_month'] = df.datetime.dt.strftime('%Y-%m')
df['date'] =df.datetime.dt.date#删除datetime
df.drop('datetime', axis = 1, inplace =True)
df
4. 可视化分析
1) 日期和总租赁数量
importmatplotlib#设置中文字体
font = {'family': 'SimHe
 最低0.47元/天 解锁文章


 1721
1721


 被折叠的 条评论
为什么被折叠?
被折叠的 条评论
为什么被折叠?
 到【灌水乐园】发言


