


简简单单使用Canvas撸个时钟
先来看一下效果
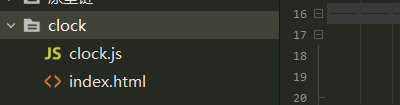
1、本次使用软件工具为HbuilderX,当然你也可以使用其他软件(Webstorm,VScode…)我们新建一个项目,项目结构如下图:
2、新建一个html文件,取名随意,好了接下来我们来简单编写一下页面的结构和样式,代码如下:
<!DOCTYPE html>
<html>
	<head>
		<meta charset="utf-8" />
		<title>Canvas Clock</title>
	</head>
	<style type="text/css">
		.canvas{
			position: fixed;
			left: 0;top: 0;right: 0;bottom: 0;
			display: flex;
			justify-content: center;
			align-items: center;
		}
		.canvas_in1{
			display: flex;
			flex-direction: column;
		}
		.canvas_in2{
			display: flex;
			justify-content: space-between;
			color: Black;
			width: 600px;
			font-weight: 600;
			line-height: 80px;
		}
		.canvas_in2_l{
			font-size: 30px;
		}
		.canvas_in2_r{
			font-size: 35px;
			color: darkblue;
		}
	</style>
	<body>
		<div class="canvas">
			<div class="canvas_in1">
				<div class="canvas_in2">
					<div class="canvas_in2_l" id="demo1"></div>
					<div class="canvas_in2_r" id="demo2"></div>
				</div>
				<canvas id="clock" height="600px" width="600px">
				    您的浏览器暂不支持 HTML5 canvas 标签。赶紧去升级吧^-^
				</canvas>
			</div>
		</div>
		<script src="clock.js" type="text/javascript" charset="utf-8"></script>
	</body>
</html>
3、新建一个js文件,取名clock,好了接下来我们来正式用canvas画时钟以及他的逻辑代码的编写。代码如下(js代码里面我加了很多注释相信大家都可以看的明白,有不懂的也可以留言和私信我大家一起学习一起进步 ^ - ^。):
var dom = document.getElementById('clock');  //获取canvas元素
var ctx = dom.getContext('2d');              //返回一个用于在画布上绘2d图的环境。
var width = ctx.canvas.width;                //获取canvas图像宽度
var height = ctx.canvas.height;              //获取canvas图像高度
var r = width / 2;                           //时钟半径
var rem = width / 200;                      //定义rem使canvas放大缩小不失真

function drawBackground() {
	//画外面粗圆边
	ctx.save();       //保存当前环境的状态
	ctx.translate(r, r);    	//重新映射画布上的 (r,r) 位置。
	ctx.beginPath();            //起始一条路径,或重置当前路径。
	ctx.strokeStyle="Black";
	ctx.lineWidth = 6 * rem;    //设置或返回当前的线条宽度。
	ctx.arc( 0, 0 , r - ctx.lineWidth / 2, 0 , 2 * Math.PI , false);  //src(圆的中心的 x 坐标, 圆的中心的 y 坐标, 圆的半径, 起始角以弧度计弧的圆形的三点钟位置是0度, 结束角以弧度计, 可选规定应该逆时针还是顺时针绘图False = 顺时针true = 逆时针)
	ctx.stroke();  //绘制已定义的路径。

	//画圆边3 ~ 12 ~ 2的数字
	var hourNumbers = [3,4,5,6,7,8,9,10,11,12,1,2];
	ctx.font = 16 * rem + 'px Arial';    //设置或返回文本内容的当前字体属性。
	ctx.textAlign = 'center';            //设置或返回文本内容的当前对齐方式。
	ctx.textBaseline = 'middle';         //设置或返回在绘制文本时使用的当前文本基线。
	// 创建一个渐变
	var gradient = ctx.createLinearGradient(-r,r,r,-r); //createLinearGradient(渐变开始点的 x 坐标,渐变开始点的 y 坐标,渐变结束点的 x 坐标,渐变结束点的 y 坐标) 方法创建线性的渐变对象。
	gradient.addColorStop("0","magenta");  //addColorStop(stop,color) 方法规定不同的颜色,以及在 gradient 对象中的何处定位颜色,stop介于 0.0 与 1.0 之间的值,表示渐变中开始与结束之间的位置。color在 stop 位置显示的 CSS 颜色值。
	gradient.addColorStop("0.2","blue");
	gradient.addColorStop("0.4","red");
	gradient.addColorStop("0.5","blue");
	gradient.addColorStop("0.6","red");
	gradient.addColorStop("0.8","blue");
	gradient.addColorStop("1.0","magenta");
	// 填充一个渐变
	ctx.fillStyle = gradient;
	hourNumbers.forEach(function(number , i){  //forEach() 方法用于调用数组的每个元素,并将元素传递给回调函数。
		var rad = 2 * Math.PI / 12 * i;        //Math.PI,PI 属性就是 π,即圆的周长和它的直径之比。这个值近似为 3.14。
		var x = Math.cos(rad) * (r - 28* rem);
		var y = Math.sin(rad) * (r - 28 * rem);
		ctx.fillText( number, x, y);  //在画布上绘制"被填充的"文本。
	});

	//画中心圆点
	for(var i = 0; i < 60; i++){
		var rad = 2 * Math.PI / 60 * i;
		var x = Math.cos(rad) * (r - 15 * rem);
		var y = Math.sin(rad) * (r - 15 * rem);
		ctx.beginPath();
		if(i % 5 === 0){
			ctx.fillStyle = 'black';
			ctx.arc(x ,y , 2 * rem, 0, 2 * Math.PI, false);
		}else{
			ctx.fillStyle = '#999999';
			ctx.arc(x ,y , 1 * rem, 0, 2 * Math.PI, false);
		}
		ctx.fill(); //填充当前绘图(路径)。

	}
};

//画时针
function drawHour(hour,minute) {
	ctx.save();    //保存当前环境的状态。
	ctx.beginPath();  //起始一条路径,或重置当前路径。
	ctx.strokeStyle="black";
	var rad = 2 * Math.PI / 720 * ((hour * 60) + minute);
	ctx.rotate(rad);    //ctx.rotate(angle);旋转当前绘图,angle旋转角度以弧度计,如需旋转 30 度,可规定下面的公式:30*Math.PI/180。
	ctx.lineWidth = 4 * rem;   //设置或返回当前的线条宽度。
	ctx.lineCap = 'round';     //设置或返回线条的结束端点样式。round向线条的每个末端添加圆形线帽。
	ctx.moveTo(0 , 10 * rem);  //把路径移动到画布中的指定点,不创建线条。 相当于提笔转点
	ctx.lineTo(0 , -r / 2);    //添加一个新点,然后在画布中创建从该点到最后指定点的线条。相当于画线条,不提笔
	ctx.stroke();              //绘制已定义的路径。
	ctx.restore();             //返回之前保存过的路径状态和属性。
};

//画分针
function drawMinute(minute,second) {
	ctx.save();
	ctx.beginPath();
	ctx.strokeStyle="#000";
	var rad = 2 * Math.PI / 3600 * ((minute * 60) + second);
	ctx.rotate(rad);
	ctx.lineWidth = 3 * rem;
	ctx.lineCap = 'round';
	ctx.moveTo(0 , 10 * rem);
	ctx.lineTo(0 , -r + 30 * rem);
	ctx.stroke();
	ctx.restore();
};

//画秒针
function drawSecond(second,millisecond) {
	ctx.save();
	ctx.beginPath();
	ctx.fillStyle = '#000';
	var rad = 2 * Math.PI / 60000 * ((second * 1000) + millisecond);
	ctx.rotate(rad);
	ctx.moveTo(-4 , 20 * rem);
	ctx.lineTo(0 , 22 * rem);
	ctx.lineTo(4 , 20 * rem);
	ctx.lineTo(1, -r + 15 * rem);
	ctx.lineTo(-1, -r + 15 * rem);
	ctx.fill();
	ctx.restore();
};

//画毫秒针
function drawmilliSecond(millisecond) {
	ctx.save();
	ctx.beginPath();
	ctx.fillStyle = 'orange';
	var rad = 2 * Math.PI / 1000 * millisecond;
	ctx.rotate(rad);
	ctx.moveTo(-1 , 20 * rem);
	ctx.lineTo(1 , 20 * rem);
	ctx.lineTo(0, -r + 15 * rem);
	ctx.lineTo(0, -r + 15 * rem);
	ctx.fill();
	ctx.restore();
};

//画中心圆点
function drawDot(){
	ctx.beginPath();
	ctx.fillStyle = 'orange'
	ctx.arc( 0 , 0 , 2 * rem , 0 , 2*Math.PI , false );
	ctx.fill();
};

function draw(){
	ctx.clearRect(0 ,0 ,width , height);  //在给定的矩形内清除指定的像素。
	var now = new Date();
	var year = now.getFullYear();
	var month = now.getMonth() + 1;
	var Dates = now.getDate();
	var hour = now.getHours();
	var minute = now.getMinutes();
	var second = now.getSeconds();
	var millisecond = now.getMilliseconds();
	drawBackground();
	drawHour(hour, minute);
	drawMinute(minute,second);
	drawSecond(second,millisecond);
	drawmilliSecond(millisecond);
	drawDot();
	ctx.restore();
	demoP1 = document.getElementById("demo1");
	demoP2 = document.getElementById("demo2");
	demoP1.innerText = year +'年' + month + '月' + Dates + '日' + hour + '时' + minute + '分' + second + '秒';
	demoP2.innerText = millisecond + '毫秒';
};
setInterval(draw,1);  //定时器,setInterval(function,time)。每隔time(其单位为毫秒)的时间执行一次function方法。
4、至此我们的代码编写完毕,然后我们编译运行到浏览器就可以看到如上gif图片的效果。


 722
722


 被折叠的 条评论
为什么被折叠?
被折叠的 条评论
为什么被折叠?
 到【灌水乐园】发言


