


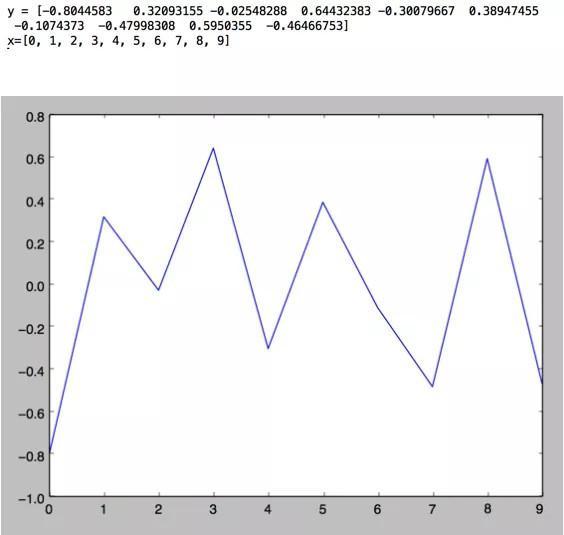
1. 用 Numpy ndarray 作为数据传入 ply
import numpy as np
import matplotlib as mpl
import matplotlib.pyplot as plt
np.random.seed(1000)
y = np.random.standard_normal(10)
print "y = %s"% y
x = range(len(y))
print "x=%s"% x
plt.plot(y)
plt.show()
2. 操纵坐标轴和增加网格及标签的函数
import numpy as np
import matplotlib as mpl
import matplotlib.pyplot as plt
np.random.seed(1000)
y = np.random.standard_normal(10)
plt.plot(y.cumsum())
plt.grid(True) ##增加格点
plt.axis('tight') # 坐标轴适应数据量 axis 设置坐标轴
plt.show()
 最低0.47元/天 解锁文章


 1万+
1万+


 被折叠的 条评论
为什么被折叠?
被折叠的 条评论
为什么被折叠?
 到【灌水乐园】发言


