


话不多说上效果图,,我声明一下,我只是提供工具,不是提供数据,谢谢合作!!!!!
如果遇到问题,请私聊我。
注释已经加满了!!!!!!!!!
 代码部分:
代码部分:
<template>
<div>
<div class="btn">
<el-button @click="getdata">路径回放</el-button>
</div>
</div>
</template>
<script>
let start = null;
let stop = null;
let entity = [];
//本地数据
/**
* @数据格式:
* {
"id": "00052db577e742229985c53bccdd22e3",
"longitude": 110.001456,
"latitude": 18.289878,
"currentTime": "2022-08-30 15:35:43",
"dwellTime": null,
"underwaterVehicleId": "b6b23aa4a90f4462948fe4b3f39dad59",
"frequency": 0,
"bandwidth": 0,
"signalstrength": 20,
"dataFlag": "1"
},
*/
import pathdata from "../../public/data";
export default {
components: { Map },
data() {
return {};
},
computed: {},
created() {},
mounted() {
this.getdata();
},
methods: {
getdata() {
this.starttruk();
this.startAir();
},
starttruk() {
const HistoryVos =
pathdata.monitoringHistoryVos[0].monitoringShipHistoryPathList;
this.startpath(
HistoryVos[0].currentTime,
HistoryVos[HistoryVos.length - 1].currentTime
);
this.StartEntiy(this.getproperty(HistoryVos), "CesiumMilkTruck.glb", 10);
},
startAir() {
const history = pathdata.vehicleHistoryVos;
for (let index = 0; index < history.length; index++) {
this.StartEntiy(
this.getproperty(history[index].vehicleHistoryPaths),
"Cesium_Air.glb",
index
);
this.gentimeentiti(index);
}
},
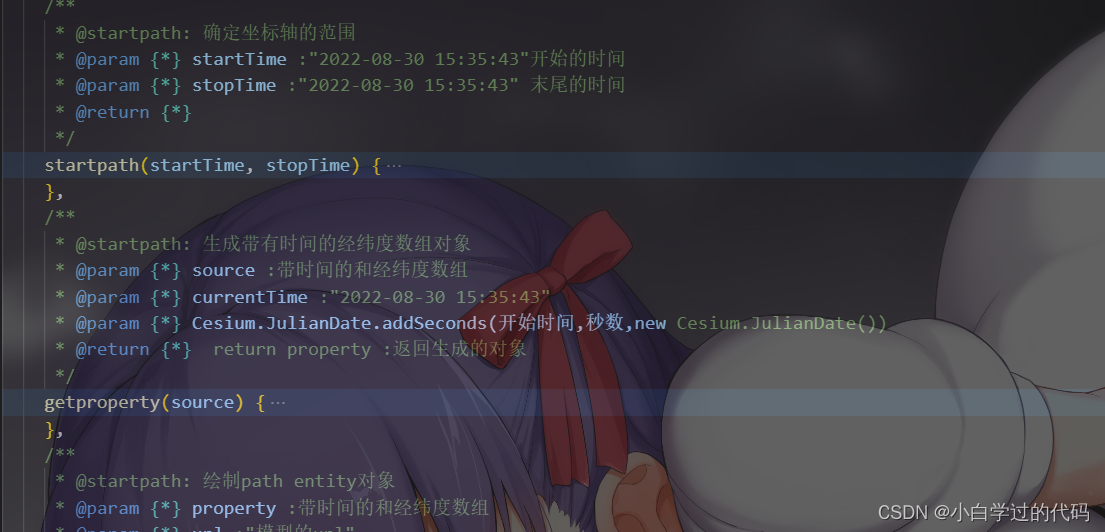
/**
* @startpath: 确定坐标轴的范围
* @param {*} startTime :"2022-08-30 15:35:43"开始的时间
* @param {*} stopTime :"2022-08-30 15:35:43" 末尾的时间
* @return {*}
*/
startpath(startTime, stopTime) {
start = Cesium.JulianDate.fromDate(new Date(startTime)); //获取第一个点的时间
stop = Cesium.JulianDate.fromDate(new Date(stopTime));
window.viewer.clock.startTime = start.clone(); //设置开始时间
window.viewer.clock.currentTime = start.clone(); //修改时间轴的当前时间
window.viewer.clock.stopTime = stop.clone();
window.viewer.clock.multiplier = 8;
window.viewer.timeline.zoomTo(start, stop); //设置时间轴时间范围
window.viewer.clock.shouldAnimate = true;
},
/**
* @startpath: 生成带有时间的经纬度数组对象
* @param {*} source :带时间的和经纬度数组
* @param {*} currentTime :"2022-08-30 15:35:43"
* @param {*} Cesium.JulianDate.addSeconds(开始时间,秒数,new Cesium.JulianDate())
* @return {*} return property :返回生成的对象
*/
getproperty(source) {
let property = null;
property = new Cesium.SampledPositionProperty();
for (let i = 0; i < source.length; i++) {
let time = Cesium.JulianDate.addSeconds(
start,
Cesium.JulianDate.fromDate(new Date(source[i].currentTime))
.secondsOfDay - start.secondsOfDay,
new Cesium.JulianDate()
);
// 添加位置,和时间对应
property.addSample(
time,
Cesium.Cartesian3.fromDegrees(
source[i].longitude,
source[i].latitude,
0
)
);
if (i == source.length - 1) {
property.addSample(
stop,
Cesium.Cartesian3.fromDegrees(
source[i].longitude,
source[i].latitude,
0
),
0
);
}
}
return property;
},
/**
* @startpath: 绘制path entity对象
* @param {*} property :带时间的和经纬度数组
* @param {*} url :"模型的url"
* @param {*} id :对entity唯一个标识
* @return {*}
*/
StartEntiy(property, url, id) {
entity[id] = window.viewer.entities.add({
availability: new Cesium.TimeIntervalCollection([
new Cesium.TimeInterval({
start: start,
stop: stop
})
]),
position: property,
orientation: new Cesium.VelocityOrientationProperty(property),
model: {
uri: url,
minimumPixelSize: 64
},
path: {
leadTime: 0,
resolution: 1,
material: new Cesium.PolylineGlowMaterialProperty({
color: Cesium.Color.WHile
}),
width: 2
}
});
window.viewer.zoomTo(entity[id]);
},
/**
* @startpath: 绘制path entity对象
* @param {*} index :对entity唯一个标识
* @return {*}
*/
gentimeentiti(index) {
let PolylinesArray = [];
window.viewer.entities.add({
polyline: {
positions: new Cesium.CallbackProperty(() => {
//监听时间轴函数
window.viewer.clock.onTick.addEventListener(function(clock) {
PolylinesArray = [
//飞艇的获取当前时间的经纬度
entity[index].position.getValue(clock._currentTime),
//获取船的当前的时间经纬度
entity[10].position.getValue(clock._currentTime)
];
});
if (PolylinesArray.length != 0) return PolylinesArray;
}, false),
width: 1,
material: Cesium.Color.YELLOW
}
});
}
}
};
</script>
<style lang="less" scoped>
.btn {
position: absolute;
z-index: 999;
top: 20px;
}
</style>


 5836
5836


 被折叠的 条评论
为什么被折叠?
被折叠的 条评论
为什么被折叠?
 到【灌水乐园】发言


