


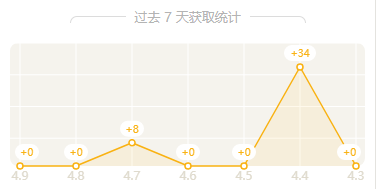
话不多说,最终实现效果如下:
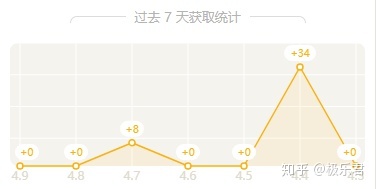
图中难点:
- 圆角矩形绘制;转载他人帖子:看此处:https://www.jb51.net/article/...
- 最左或者最右边的气泡需要做动态偏移
本项目是由mpvue写的小程序:所以用的是vue的书写格式(微信小程序可以自行修改):
使用方法:
- 将下列代码新建linechart.vue文件
- 再项目中调用本组件的drawAll方法传入日期和值即可
代码中有少量注解请不懂的给我留言
<template>
    <div class="linechart">
        <canvas class="circle"  canvas-id="canvasline" style="width: 750rpx;height: 280rpx;">
        </canvas></div>
</template>

<script>
     export default {
         data() {
            return {
                canvasWidth: 375,
                canvasHeight: 123,
                date: ['-/-','-/-','-/-','-/-','-/-','-/-','-/-'],
                value: [0,0,8,10,6,0,0,],
                len: 4,
                xcoords: []
            }
         },
        onLoad() {
            this.drawAll()
        },
        methods: {
            drawAll(date, value) {
                this.date = date || this.date
                this.value = value || this.value
                var ctx = wx.createCanvasContext('canvasline')
                this.roundRect(ctx, this.px2PX(10), 0, this.px2PX(this.canvasWidth) - this.px2PX(20), this.px2PX(this.canvasHeight), this.px2PX(8), '#F5F3ED');
                this.drawYLine(ctx, this.px2PX(20), 0, this.px2PX(20), this.px2PX(this.canvasHeight),this.px2PX(55), this.px2PX(1), 'white')
                this.drawXLine(ctx, this.len, this.px2PX(1), 'white');
                this.drawLine(ctx, this.px2PX(1.5), this.px2PX(3))
                ctx.draw()
            },
            px2PX(px) { // px (Int) 375为设计稿宽度,根据屏幕动态设置像素大小解决模糊问题和适配
                return  (wx.getSystemInfoSync().screenWidth / 375) * Number(px)
            },
            /**
              *
              * @param {CanvasContext} ctx canvas上下文
              * @param {number} x 圆角矩形选区的左上角 x坐标
              * @param {number} y 圆角矩形选区的左上角 y坐标
              * @param {number} w 圆角矩形选区的宽度
              * @param {number} h 圆角矩形选区的高度
              * @param {number} r 圆角的半径
              * @param {color} fillColor 填充的颜色
            */
            // 绘制矩形
            roundRect(ctx, x, y, w, h, r, fillColor) {
                if (w < 2 * r) r = w / 2;
                if (h < 2 * r) r = h / 2;
                // 开始绘制
                ctx.beginPath()
                // 因为边缘描边存在锯齿,最好指定使用 transparent 填充
                // 这里是使用 fill 还是 stroke都可以,二选一即可
                // ctx.setFillStyle('transparent')
                // ctx.setStrokeStyle('transparent')
                // 左上角
                ctx.arc(x + r, y + r, r, Math.PI, Math.PI * 1.5)

                // border-top
                ctx.moveTo(x + r, y)
                ctx.lineTo(x + w - r, y)
                ctx.lineTo(x + w, y + r)
                // 右上角
                ctx.arc(x + w - r, y + r, r, Math.PI * 1.5, Math.PI * 2)

                // border-right
                ctx.lineTo(x + w, y + h - r)
                ctx.lineTo(x + w - r, y + h)
                // 右下角
                ctx.arc(x + w - r, y + h - r, r, 0, Math.PI * 0.5)

                // border-bottom
                ctx.lineTo(x + r, y + h)
                ctx.lineTo(x, y + h - r)
                // 左下角
                ctx.arc(x + r, y + h - r, r, Math.PI * 0.5, Math.PI)

                // border-left
                ctx.lineTo(x, y + r)
                ctx.lineTo(x + r, y)
                ctx.setFillStyle(fillColor);
                // 这里是使用 fill 还是 stroke都可以,二选一即可,但是需要与上面对应
                ctx.fill()
                // ctx.stroke()
                ctx.closePath()
                // 剪切
                // ctx.clip()
            },
            /**
              *
              * @param {CanvasContext} ctx canvas上下文
              * @param {number, number, number, number} x1, y1, x2, y2 第一条线的起始坐标和结束坐标
              * @param {number} spacing 线条直接的间隔
              * @param {number} lineWidth 线条宽度
              * @param {color} color线条的颜色
            */
            // 绘制竖线网格和底部文字
            drawYLine(ctx, x1, y1, x2, y2, spacing, lineWidth, color) {
                ctx.beginPath();
                let width = this.px2PX(this.canvasWidth) - (x1 * 2)
                let len = Math.floor(width /spacing)
                for (let i = 0; i <= len; i++) {
                    let spaced = spacing * i + i;
                    this.xcoords.push(x1 + spaced)
                    ctx.setLineWidth(lineWidth)
                    ctx.setStrokeStyle(color)
                    ctx.moveTo(x1 + spaced, y1);
                    ctx.lineTo(x2 + spaced, y2);
                    /* --- 底部标尺文字 -- */
                    ctx.setFontSize(this.px2PX(12));
                    ctx.setTextAlign('center');
                    ctx.setFillStyle('#DFDACD');
                    ctx.fillText(this.date[i], x1 + spaced, y2 + this.px2PX(14))
                    /* ---- 底部标尺文字 --- */
                }
                ctx.stroke()
            },
            /**
              *
              * @param {CanvasContext} ctx canvas上下文
              * @param {number} len 绘制多少条横线
              * @param {number} lineWidth 线条宽度
              * @param {color} color线条的颜色
            */
            // 绘制横线网格
            drawXLine(ctx, len, lineWidth, color) {
                ctx.beginPath();
                let spaced = this.px2PX(this.canvasHeight) / len
                let x = this.px2PX(this.canvasWidth)
                for (let i = 0; i < len; i++) {
                    let hei = spaced * i + i
                    ctx.moveTo(0, hei);
                    ctx.lineTo(x, hei);
                }
                ctx.setLineWidth(lineWidth)
                ctx.setStrokeStyle(color)
                ctx.stroke()
            },
            /**
              *
              * @param {CanvasContext} ctx canvas上下文
              * @param {number} width 折线的线条宽度
              * @param {number} r 折线拐角的圆的半径
            */
            // 绘制折线,折线区域,气泡,气泡文字
            drawLine(ctx, width,r) {
                let arrMax = Math.max.apply({},this.value)
                let height = this.px2PX(this.canvasHeight)
                let hei = this.px2PX(this.canvasHeight) - this.px2PX(24)
                let average = arrMax <= 0 ? 0 : hei / arrMax
                let len = this.value.length - 1
                ctx.beginPath();
                /* 折线 */
                for (let i = 0; i < len; i++) {
                    let x1 = this.xcoords[i], y1 = height - this.value[i] * average, x2 = this.xcoords[i+1], y2 =  height - this.value[i + 1] * average
                    ctx.moveTo(x1, y1)
                    ctx.lineTo(x2, y2)
                }
                ctx.setStrokeStyle('#F9B213');
                ctx.setLineWidth(width);
                ctx.stroke()
                /* 折线 */
                /* 折线区域 */
                ctx.beginPath();
                for (let i = 0; i < len; i++) {
                    let x1 = this.xcoords[i], y1 = height - this.value[i] * average, x2 = this.xcoords[i+1], y2 = height - this.value[i + 1] * average
                    ctx.moveTo(x1, y1)
                    ctx.lineTo(x2, y2)
                    ctx.lineTo(x2, height)
                    ctx.lineTo(x1, height)
                }
                /* 折线区域 */
                ctx.setFillStyle('rgba(249,178,19,0.08)');
                ctx.fill();

                for (let i = 0; i <= len; i++) {
                    let x1 = this.xcoords[i], y1 = height - this.value[i] * average
                    ctx.beginPath();
                    ctx.arc(x1, y1, r, 0, 2 * Math.PI)
                    ctx.setStrokeStyle('#F9B213');
                    ctx.setLineWidth(width);

                    ctx.setFillStyle('white');
                    ctx.fill();
                    ctx.stroke()
                }
                for (let i = 0; i <= len; i++) {
                    let x1 = this.xcoords[i], y1 = height - this.value[i] * average
                    let defaultWidth = this.px2PX(24), defaultHeight = this.px2PX(16)
                    let fontsize = this.px2PX(10)
                    let lense = this.value[i].toString().length
                    if (lense > 1) {
                        defaultWidth = defaultWidth + lense * fontsize / 2.5
                    }
                    let x = x1 - defaultWidth / 2
                    let y = y1 - defaultHeight - r * 2
                    if (i === 0) { // 第一个文字tip向右
                        x = x1 - fontsize / 2
                        ctx.setTextAlign('left');
                    } else if (i === len) { // 最后一个文字tip向左
                        x = x - defaultWidth / 2 + fontsize / 2
                        ctx.setTextAlign('right');
                    } else {
                        ctx.setTextAlign('center');
                    }
                    this.roundRect(ctx, x, y, defaultWidth, defaultHeight, this.px2PX(8), 'white')
                    ctx.beginPath();
                    ctx.setFontSize(fontsize);
                    ctx.setFillStyle('#F9B213');
                    ctx.fillText('+'+this.value[i], x1, y1 - this.px2PX(10))
                    ctx.closePath()
                }
            }
        }
     }
</script>

<style lang="scss">
    .linechart {
        width: 750upx;
        height: 280upx;
    }
</style>
以上列子如有疑问,请给我留言。
作者:smallStone
原文:微信小程序内使用canvas绘制自定义折线图表-实战教程-小程序社区-微信小程序-微信小程序开发社区-小程序开发论坛-微信小程序联盟


 695
695


 被折叠的 条评论
为什么被折叠?
被折叠的 条评论
为什么被折叠?
 到【灌水乐园】发言


