echarts实现饼图见渐变

本文详细介绍了如何在ECharts的饼图中使用`itemStyle`属性为不同部分设置颜色渐变,包括颜色的线性渐变配置方法。
摘要由CSDN通过智能技术生成

在这里插入图片描述

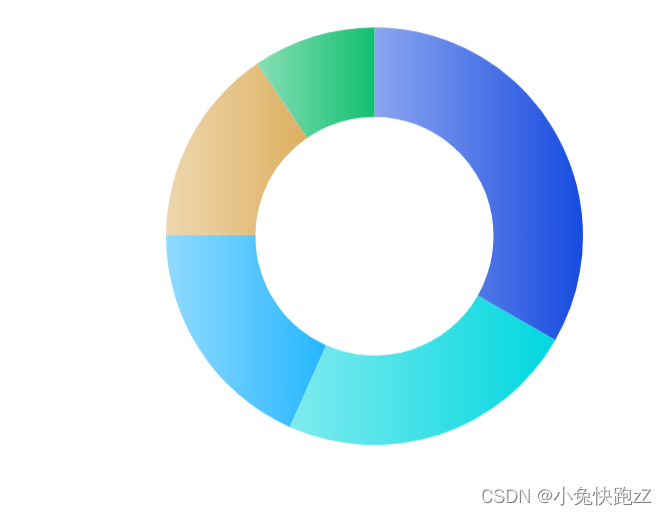
数据中添加itemStyle,修改颜色为渐变色

option = {
  tooltip: {
    show:false,
    trigger: 'item'
  },
  legend: {
    top: '5%',
    left: 'center'
  },
  series: [
    {
      name: 'Access From',
      type: 'pie',
      radius: ['40%', '70%'],
      avoidLabelOverlap: false,
      
      label: {
        show: false,
        position: 'center',
        color: 'red'
      },
      emphasis: {
        label: {
          show: true,
          fontSize: 40,
          fontWeight: 'bold',
          formatter(data){
    
            return '111'
          },
          color: new echarts.graphic.LinearGradient(0, 0, 0, 1, [{
            offset: 0,
            color: 'blue'
        }, {
            offset: 1,
            color: 'red'
        }])
        }
      },
      labelLine: {
        show: false
      },
      data: [
        { value: 1048, name: 'Search Engine',itemStyle: {
            color: new echarts.graphic.LinearGradient( 0, 1, 1, 1,
                [
                    {offset: 0, color: 'rgba(23, 75, 224, 0.5)'},
                    {offset: 1, color: 'rgba(23, 75, 224, 1)'}, 
                ]
            )
          },
 },
        { value: 735, name: 'Direct',itemStyle: {
            color: new echarts.graphic.LinearGradient( 0, 1, 1, 1,
                [
                    {offset: 0, color: 'rgba(0, 215, 223, 0.5)'},
                    {offset: 1, color: 'rgba(0, 215, 223, 1)'}, 
                ]
            )
          }, },
        { value: 580, name: 'Email',itemStyle: {
            color: new echarts.graphic.LinearGradient( 0, 1, 1, 1,
                [
                    {offset: 0, color: 'rgba(36, 182, 255, 0.5)'},
                    {offset: 1, color: 'rgba(36, 182, 255, 1)'}, 
                ]
            )
          }, },
        { value: 484, name: 'Union Ads',itemStyle: {
            color: new echarts.graphic.LinearGradient( 0, 1, 1, 1,
                [
                    {offset: 0, color: 'rgba(221, 175, 96, 0.5)'},
                    {offset: 1, color: 'rgba(221, 175, 96, 1)'}, 
                ]
            )
          }, },
        { value: 300, name: 'Video Ads',itemStyle: {
            color: new echarts.graphic.LinearGradient( 0, 1, 1, 1,
                [
                    {offset: 0, color: 'rgba(18, 191, 111, 0.5)'},
                    {offset: 1, color: 'rgba(18, 191, 111, 1)'}, 
                ]
            )
          }, }
      ]
    }
  ]
};

  • 3
    点赞
  • 0
    收藏
    觉得还不错? 一键收藏
  • 0
    评论
你可以使用 echarts 提供的渐变色功能来实现饼图的颜色渐变效果。下面是一个使用 Vue 和 echarts 实现饼图颜色渐变的示例代码: ```vue <template> <div> <div ref="chart" style="width: 600px; height: 400px;"></div> </div> </template> <script> import echarts from 'echarts' export default { mounted() { this.renderChart() }, methods: { renderChart() { const chart = echarts.init(this.$refs.chart) const data = [ { value: 335, name: '数据1' }, { value: 310, name: '数据2' }, { value: 234, name: '数据3' }, { value: 135, name: '数据4' }, { value: 1548, name: '数据5' } ] const colors = ['#FF5733', '#FFB233', '#FFE333', '#B9FF33', '#33FFA8'] // 创建渐变色数组 const gradientColors = [] for (let i = 0; i < colors.length; i++) { gradientColors.push( { offset: i / (colors.length - 1), color: colors[i] } ) } const option = { series: [ { type: 'pie', data: data, itemStyle: { // 设置渐变色 color: new echarts.graphic.LinearGradient(0, 0, 1, 1, gradientColors) } } ] } chart.setOption(option) } } } </script> <style> </style> ``` 在这个示例代码中,我们首先引入 echarts 库,然后在 `mounted` 钩子函数中初始化图表,并在 `renderChart` 方法中设置饼图的数据和渐变色。我们使用 `LinearGradient` 类来创建渐变色,通过设置不同的偏移量和颜色值来定义渐变效果。 你可以根据需要修改 `data` 数组和 `colors` 数组来调整饼图的数据和颜色。注意,渐变色的个数应该与饼图数据的个数一致,以保证每个扇形区域都有对应的渐变色。 希望这个示例对你有帮助!
评论
添加红包

请填写红包祝福语或标题

红包个数最小为10个

红包金额最低5元

当前余额3.43前往充值 >
需支付:10.00
成就一亿技术人!
领取后你会自动成为博主和红包主的粉丝 规则
hope_wisdom
发出的红包
实付
使用余额支付
点击重新获取
扫码支付
钱包余额 0

抵扣说明:

1.余额是钱包充值的虚拟货币,按照1:1的比例进行支付金额的抵扣。
2.余额无法直接购买下载,可以购买VIP、付费专栏及课程。

余额充值