


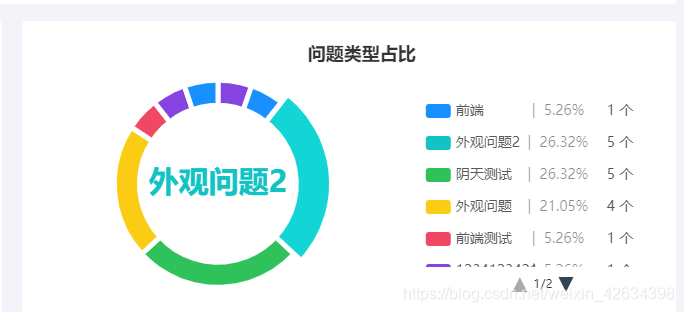
echars legend过多 翻页显示,格式化图例
最终效果展示
可参考官网实例:
链接: https://www.echartsjs.com/examples/zh/editor.html?c=pie-legend.
核心代码参考
显示翻页
只需要 在legend 加上 type:‘scroll’ 属性,
一定要绑定data,
一开始我没有在legend绑定data,
都可以正常显示不用翻页 不绑定data是没有问题的,
但是 加上翻页就要绑定data!!!
只要加翻页不用 格式化图例显示的
按照官方的 例子copy过去改下数据源就可以!
  legend: {
              type: 'scroll', // 显示分页
              orient: 'vertical',
              right: 10,
              top: 20,
              bottom: 20,
              data: ld, // 显示分页要加
              selectedMode: false, // 关闭图例的选择模式
                 // 格式化图例
              formatter: function(name) {
                             if(!arr[name]) {
                                       return name;
                             }
return '{title|' + name + '} \t{value|' + '\t|\t\t' + ((arr[name].value / sum) * 100).toFixed(2) + '%\t' + '} \t{title|' + arr[name].value + ' 个' + '}';
                    },
           // 格式化图例
           textStyle: {

                   rich: {
                         title: {
                                  fontSize: 14,
                                  lineHeight: 22,
                                  color: '#595959',
                                  width: 80
     },
                     value: {
                              fontSize: 14,
                              lineHeight: 22,
                              color: 'rgba(0,0,0,0.45)',
                              width: 30,
                              align: 'center'
                               }
                          }
                   }
      },
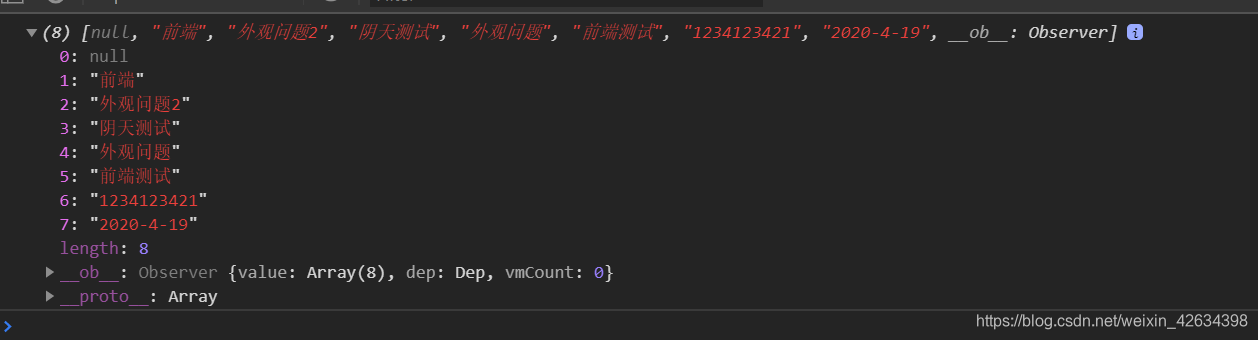
数据格式
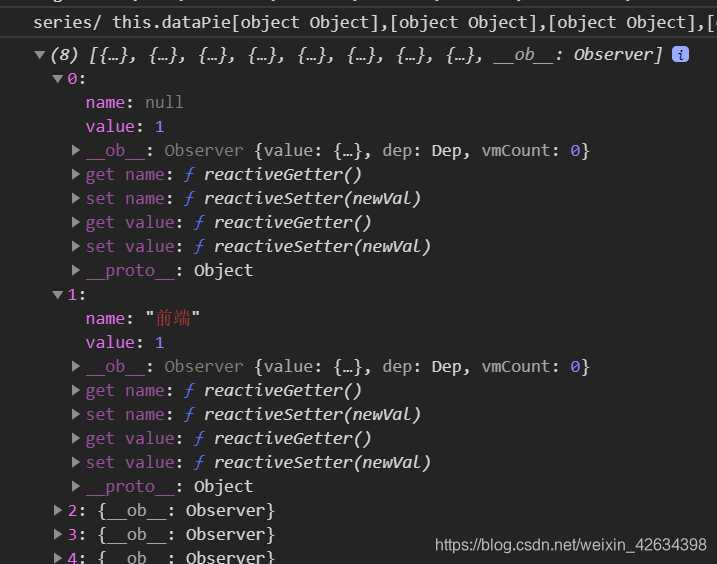
series:
legend:
全部代码参考
      let ld = this.legendData;
      let sum = this.sumCount;
      let arr = [];
      for (let i = 0; i < this.dataPie.length; i++) {
    arr[this.dataPie[i]['name']] = this.dataPie[i];
           }
    let that = this;
    that.per = echarts.init(that.$refs.proPer);
        let option = {
            title: {
               text: '问题类型占比',
               left: '43%',
               top: 20
                     },
           tooltip: {
                trigger: 'item',
                formatter: '{a} <br/>{b}: {c} ({d}%)'                },
           legend: {
                type: 'scroll', // 显示分页
                orient: 'vertical',
                right: 10,
                top: 20,
                bottom: 20,
                data: ld, // 显示分页要加
                selectedMode: false, // 关闭图例的选择模式
                // 格式化图例
         formatter: function(name) {
            if(!arr[name]) {
                return name;
          }
      return '{title|' + name + '} \t{value|' + '\t|\t\t' + ((arr[name].value / sum) * 100).toFixed(2) + '%\t' + '} \t{title|' + arr[name].value + ' 个' + '}';
                },
      // 格式化图例
         textStyle: {
             rich: {
                title: {
                 fontSize: 14,
                lineHeight: 22,
                 color: '#595959',
               width: 80
                  },
                    value: {
                     fontSize: 14,
                 lineHeight: 22,
               color: 'rgba(0,0,0,0.45)',
             width: 30,
                 align: 'center'
                                }
                           }
                     }
             },
         color: ['#8543E0', '#1890FF', '#13C2C2', '#2FC25B', '#FACC14', '#F04864'],
         series: [
              {
                 name: '问题类型占比',
                 type: 'pie',
                 center: ['30%', '55%'],
                 radius: ['53%', '70%'],
                 avoidLabelOverlap: false,
         label: {
             normal: {
                 show: false,
                 position: 'center'
             },
             emphasis: {
                 show: true,
         textStyle: {
                 fontSize: '30',
                 fontWeight: 'bold'
                 }
           }
       },

      labelLine: {
         normal: {
                 show: false
                }
          },
     itemStyle: {
                 shadowOffsetX: 0,
                 borderColor: '#fff',
                 borderWidth: 5
         },
                 data: this.dataPie
               }
          ]
      };
    let index = 0;
    if (ld.length > 8) {
          option.legend.top = '0%';
          option.legend.itemGap = 3;
     } else {
          option.legend.top = '25%';
       }

 that.per.setOption(option);
 that.per.dispatchAction({ type: 'highlight', seriesIndex: 0, dataIndex: 0 }); // 设置默认选中高亮部分
   that.per.on('mouseover', function(e) {
     if (e.dataIndex != index) {
        that.per.dispatchAction({ type: 'downplay', seriesIndex: 0, dataIndex: index });
            }
       });
   that.per.on('mouseout', function(e) {
      index = e.dataIndex;
      that.per.dispatchAction({ type: 'highlight', seriesIndex: 0, dataIndex: e.dataIndex
         });
   });


 471
471


 被折叠的 条评论
为什么被折叠?
被折叠的 条评论
为什么被折叠?
 到【灌水乐园】发言


