


1. 指标数据
1.1 数据基础
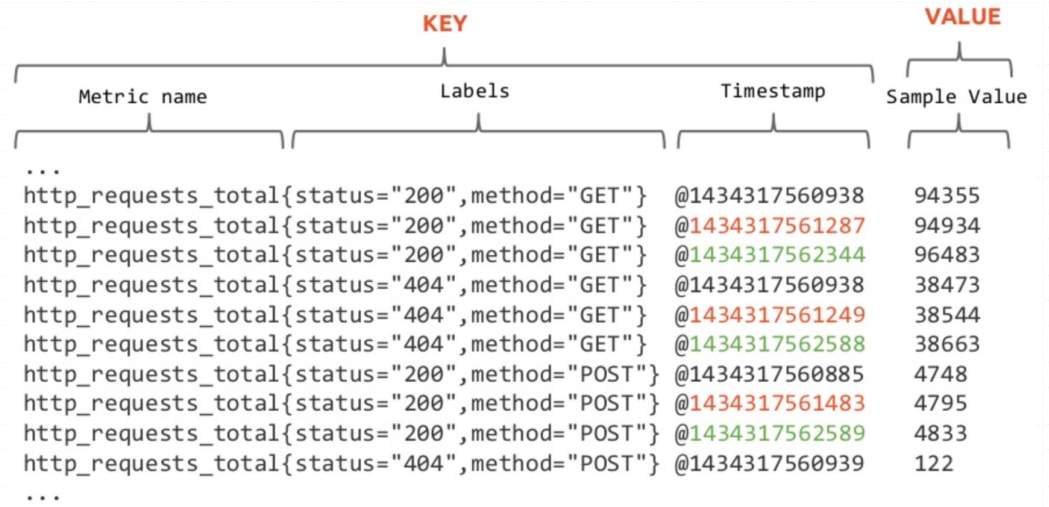
时间序列数据:
按照时间顺序记录系统、设备状态变化的数据,每个数据称为一个样本
数据采集以特定的时间周期进行,随着时间将这些样本数据记录下来,将生成一个离散的样本数据 序列,该序列也称为向量(Vector)
将多个序列放在同一个坐标系内(以时间为横轴,以序列为纵轴),将形成一个由数据点组成的矩阵

Prometheus基于指标名称(metrics name)以及附属的标签集(labelset)唯一定义一条时间序列
指标名称代表着监控目标上某类可测量属性的基本特征标识
标签则是这个基本特征上再次细分的多个可测量维度
1.2 数据模型
Prometheus中,每个时间序列都由指标名称(Metric Name)和标签(Label)来唯一标识,格式为
<metric name>{<label name>=<label value>, ...}”;
指标名称:通常用于描述系统上要测定的某个特征
支持使用字母、数字、下划线和冒号,且必须能匹配RE2规范的正则表达式
例如,http_requests_total表示接收到的HTTP请求总数
标签:键值型数据,附加在指标名称之上,从而让指标能够支持多纬度特征;此为可选项
标签名称可使用字母、数字和下划线,且必须能匹配RE2规范的正则表达式
以“__”为前缀的名称为Prometheus系统预留使用
例如: 下面代表着两个不同的时间序列
http_requests_total{method=GET}
http_requests_total{method=POST}
Metric Name的表示方式有两种,其中后一种通常用于Prometheus内部,效果如下

样本数据
Prometheus的每个数据样本由两部分组成
float64格式的数据
毫秒精度的时间戳
注意事项
指标名称和标签的特定组合代表着一个时间序列
指标名称相同,但标签不同的组合分别代表着不同的时间序列
不同的指标名称自然更是代表着不同的时间序列
PromQL支持基于定义的指标维度进行过滤和聚合
更改任何标签值,包括添加或删除标签,都会创建一个新的时间序列
应该尽可能地保持标签的稳定性,否则,则很可能创建新的时间序列,更甚者会生成一个动态的数据环境,并使得监控的数据源难以跟踪,从而导致建立在该指标之上的图形、告警及记录规则变得无效
2. 查询基础
2.1 PromQL简介
Prometheus 提供一个内置的函数式的表达式语言PromQL(Prometheus Query Language),可以使用 户实时地查找和聚合时间序列数据。表达式计算结果可以在图表中展示,也可以在Prometheus表达式浏览器中以表格形式展示,或者作为数据源, 以HTTP API的方式提供给外部系统使用。
注意:默认情况下,是以当前时间为基准点,来进行数据的获取操作
2.2 表达式形式
官方文档
https://prometheus.io/docs/prometheus/latest/querying/basics/
表达式: 每一个PromQL其实都是一个表达式,这些语句主要有四种存在样式:
数据类型
instant vector 瞬时数据
在某一时刻,抓取的所有监控项数据。这些度量指标数据放在同一个key中。
range vector 范围数据
在某一个时间段内,抓取的所有监控项数据。
数据格式
scalar 标量
一个简单的浮点类型数值
string 字符串
一个之前没有被使用的简单字符串
日常图形展示中用到的数据就是基于上面四种样式组合而成的综合表达式,效果如下
PromQL的查询操需要针对有限个时间序列上的样本数据进行,挑选出目标时间序列是构建表达式时最 为关键的一步,然后根据挑选出给定指标名称下的所有时间序列或部分时间序列的即时(当前)样本值或 至过去某个时间范围内的样本值。
基本语法
对于PromQL来说,以下的几个基础知识是我们必须掌握和熟练应用的
数值
对于数值来说,主要记住两种类型的数值:字符串和数字。
字符串
字符串可以用单引号,双引号或反引号指定为文字,如果字符串内的特殊符号想要生效,我们可以使用反引 号。
"this is a string"
'these are unescaped: n t'
`these are not unescaped: n ' " t`
数字
#对于数据值的表示,可以使用我们平常时候的书写方法 "[-](digits)[.(digits)]"
2、2.43、-2.43等
2.3 数据选择器
所谓的数据选择器,其实指的是获取实时数据或者历史数据的一种方法
样式:
metrics_name{筛选label=值,...}[<时间范围>] offset <偏移>

它主要以下几种分类:
2.3.1 实时选择器 :
获取及时的一组时间序列和单个样本值,根据数据的精确度,可以有以下几种使用方法:
根据监控项名称获取最新值
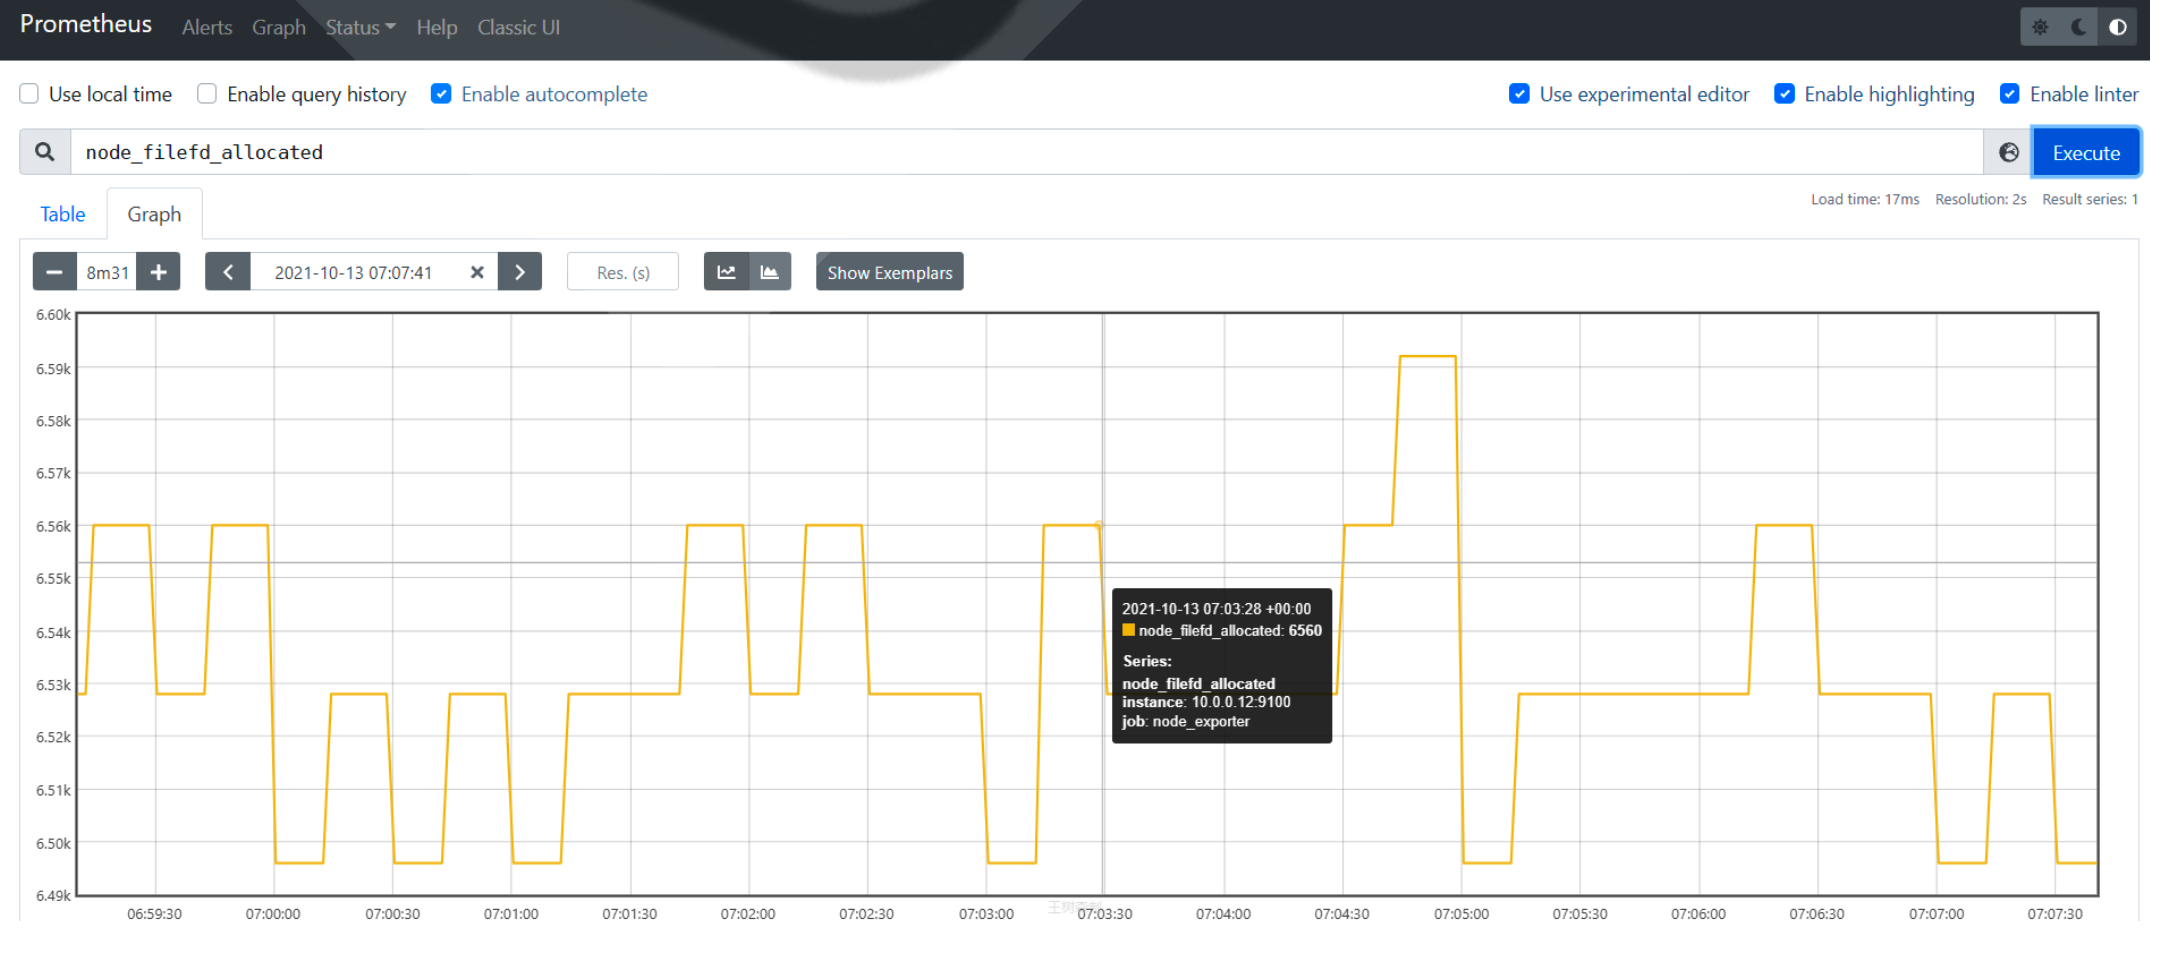
node_filefd_allocated
prometheus_http_requests_total
通过{key=value,}样式获取符合条件的数据值
prometheus_http_requests_total{instance="localhost:9090", job="prometheus"}
prometheus_http_requests_total{handler=~".*meta.*"}
#属性解析:
多个条件间可以使用逗号","隔开,每个条件内部可以通过多种符号,表示不同含义
=(精确匹配)、!=(不匹配)、=~(正则匹配)、!~(正则不匹配)
如果条件中存在多值,可以使用"|"表示或的意思,env=~"staging|testing|development"
条件中必须包含一个与空标签值不匹配的选择器,不能写成{job=~".*"}
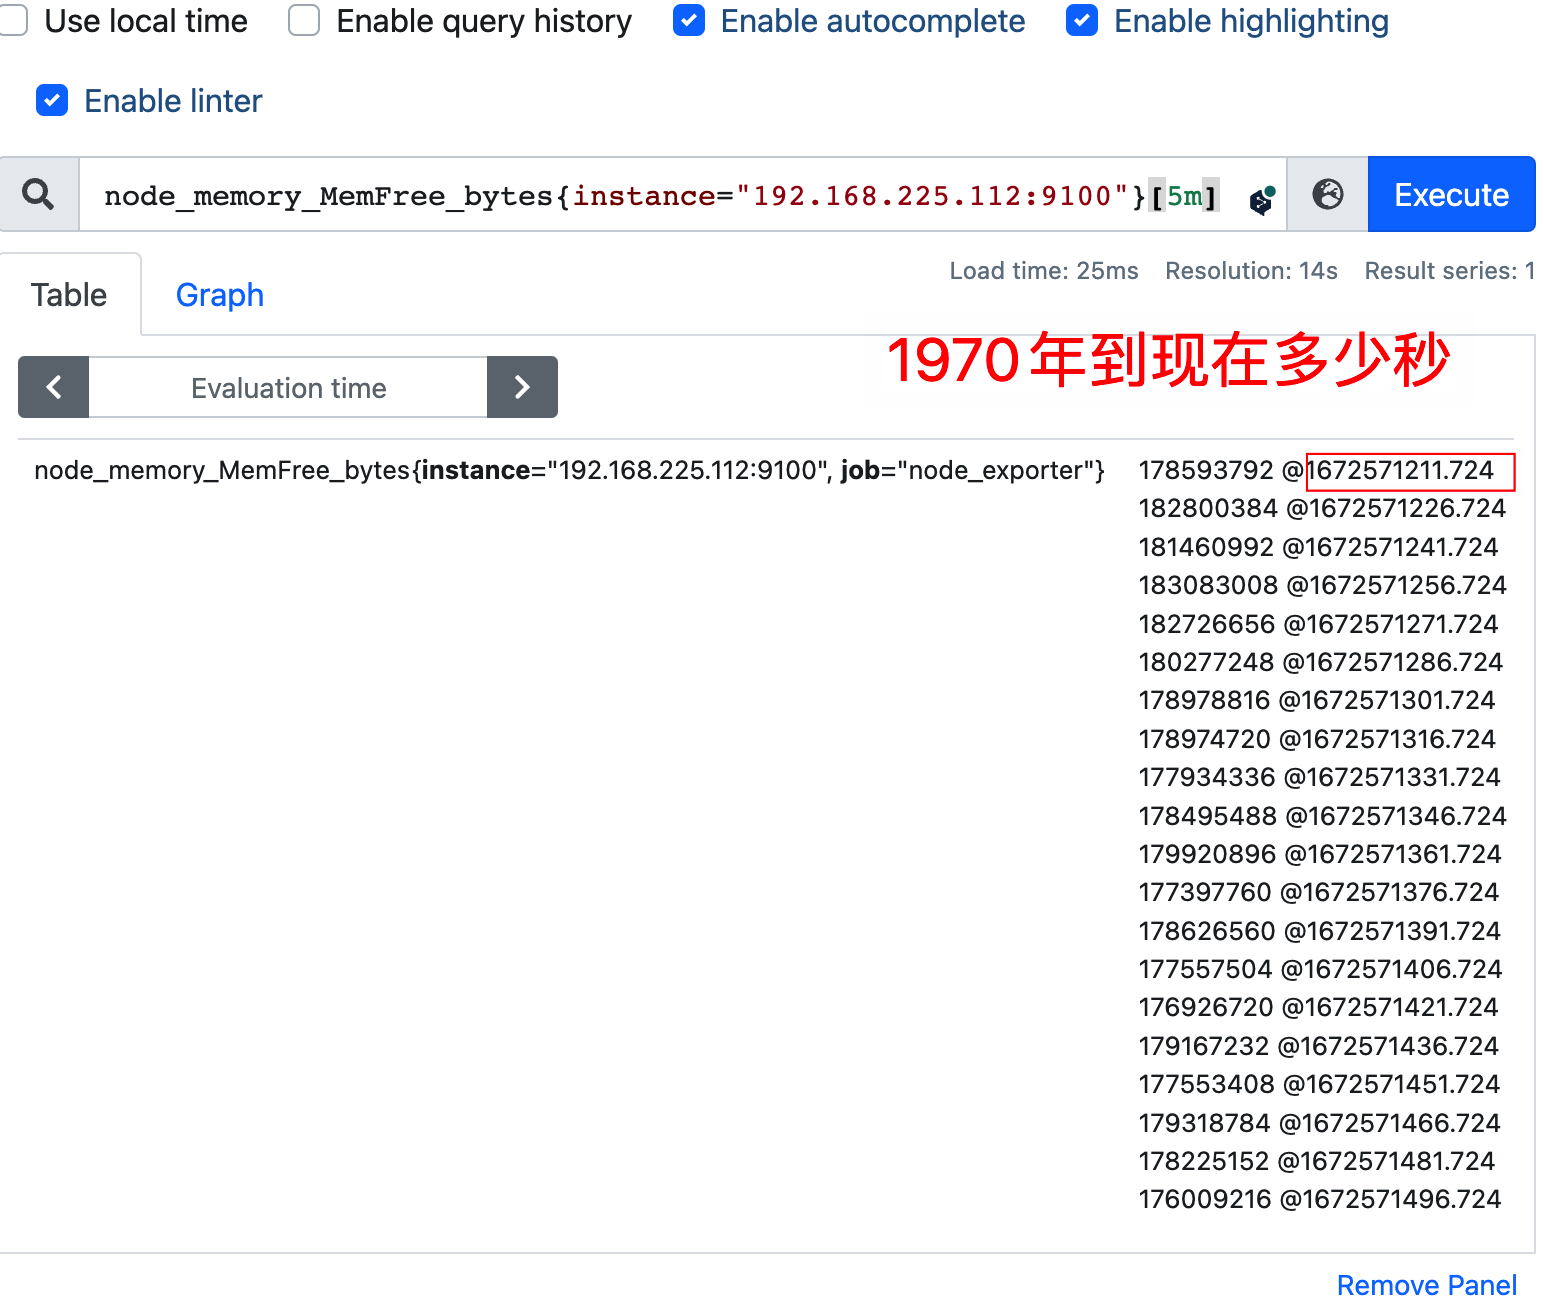
node_memory_MemFree_bytes{instance=~"10.0.0.(101|102):9100"}
#注意:指标 prometheus_http_requests_total 默认情况下,针对的是 localhost:9090 的 target,其他无效
通过 __name__ 匹配多个监控项的名称
{__name__="prometheus_http_requests_total"}
{__name__=~"^prometheus.*"}
2.3.2 范围选择器
工作方式与瞬时向量选择器一样,区别在于时间范围长一些,主要是在瞬时选择器多了一个[]格式的时 间范围后缀,在[]内部可以采用多个单位表示不同的时间范围,比如s(秒)、m(分)、h(时)、d(日)、 w(周)、y(年)。
prometheus_http_requests_total{job="prometheus"}[5m]
#属性解析:这表示过去5分钟内的监控数据值,这些数据一般以表格方式展示,而不是列表方式展示
注意:范围向量选择器返回的是一定时间范围内的数据样本,虽然不同时间序列的数据抓取时间点相同,但它们的时间戳并不会严格对齐
多个Target上的数据抓取需要分散在抓取时间点前后一定的时间范围内,以均衡Prometheus Server的负载
因而,Prometheus在趋势上准确,但并非绝对精准

2.3.3 偏移修饰符
范围选择器可以获取最近时间段的数据,而对于某个历史时间段中的数据,就需要通过offset时间偏移的方式来进行获取了。
prometheus_http_requests_total offset 5m
prometheus_http_requests_total{code="200"} offset 5m
prometheus_http_requests_total{handler="/metrics"}[5m] offset 3m
#注意:offset与数据选择器是一个整体,不能分割,offset 偏移的是时间点
如果既有偏移又有范围,先偏移后再取范围,如[5m] offset 3m 表示取当前时间的3分钟前的5m范围的值
3. 查询语法格式
对于PromQL来说,它的操作符号主要有以下两类:
二元运算符
聚合运算
3.1 二元运算符
对于二元运算符来说,它主要包含三类:算术、比较、逻辑,作用效果与我们平常使用的效果一致。
#算术运算符:+、-、*、/、%、^
#比较运算符:==、!=、=~、!~>、<、>=、<=
#逻辑运算符:and、or、unless 目前该运算符仅允许在两个即时向量之间进行操作,不支持标量(标量只有 一个数字,没有时序)参与运算
#运算符优先级: 1^
2 *, /, %
3 +, -
4 ==, !=, <=, <, >=, >
5 and, unless
6 or
#注意:二元运算符是prometheus进行数据可视化或者数据分析操作的时候,应用非常多的一种功能。
简单示例
#单位换算
node_memory_MemFree_bytes / (1024 * 1024)
#可用内存占用率
node_memory_MemAvailable_bytes/node_memory_MemTotal_bytes * 100
#内存使用率
(node_memory_MemTotal_bytes - node_memory_MemFree_bytes) / node_memory_MemTotal_bytes * 100
#磁盘使用率
(node_filesystem_size_bytes{mountpoint="/"} -
node_filesystem_free_bytes{mountpoint="/"})
/node_filesystem_size_bytes{mountpoint="/"} * 100
#阈值判断
(node_memory_MemTotal_bytes - node_memory_MemFree_bytes) /
node_memory_MemTotal_bytes > 0.95
#内存利用率是否超过80
( 1 - node_memory_MemAvailable_bytes/node_memory_MemTotal_bytes ) * 100 > bool
80
prometheus_http_requests_total > bool 1000 #布尔值,当超过1000为1,否则为0
#注意:
对于比较运算符来说,条件成立有结果输出,否则没有结果输出
使用bool修改符后,布尔运算不会对时间序列进行过滤,而是直接依次瞬时向量中的各个样本数据与标量的比
较结果0或者1。从而形成一条新的时间序列。

集合处理
#并集
#写法一
node_memory_MemTotal_bytes{instance="10.0.0.104:9100"} or
node_memory_MemFree_bytes{instance="10.0.0.105:9100" }
#写法二
node_memory_MemTotal_bytes{instance=~"10.0.0.(103|104):9100"}
#交集
node_memory_MemTotal_bytes{instance="10.0.0.101:9100"} and
node_memory_MemFree_bytes{instance="10.0.0.104:9100" }
#补集
node_memory_MemTotal_bytes{job_name="k8s-node"} unless
node_memory_MemTotal_bytes{instance="10.0.0.104:9100"} #在前面大的集合中排除机器
#注意:
and、or、unless 主要是针对获取的数据值进行条件选集合用的
and、or、unless 针对的对象是一个完整的表达式

3.2 聚合操作
官方文档
https://prometheus.io/docs/prometheus/latest/querying/operators/
聚合操作符aggregation operators虽然是一个个的功能,但是并不属于功能函数,仅仅代表对数据进行 简单的功能处理。
常见的方法有:
sum、min、max、avg、count、count_values(值计数)
stddev(标准差)、stdvar(标准差异)、bottomk(最小取样)、topk(最大取样)、quantile(分布统计)
格式
聚合操作符(metric表达式) sum、min、max、avg、count等
聚合操作符(描述信息,metric) count_values、bottomk、topk等
可以借助于without和by功能获取数据集中的一部分进行分组统计,格式如下
sum(数据选择表达式) without|by (<label list>)
#without 表示显示信息的时候,不包括指定的标签列表的分组统计
#by表示显示信息的时候,仅显示指定的标签的分组统计
示例
#内存总量
sum(node_memory_MemTotal_bytes)
#确认CPU的总个数
count(node_cpu_seconds_total{mode='system'})
#获取最大的值
max(prometheus_http_requests_total)
#分组统计计数
count_values("counts",node_filesystem_size_bytes)
#获取前5个最大值
topk(5, prometheus_http_requests_total)
#分组求和,除了job
sum(prometheus_http_requests_total) without (job)
#分组求和,仅仅是mode
sum(node_cpu_seconds_total) by (mode)
3.3 功能函数
官方文档
https://prometheus.io/docs/prometheus/latest/querying/functions/
默认情况下,prometheus官方默认的功能函数有40个,主要有以下几类
计算相关
绝对值abs()、导数deriv()、指数exp()、对数ln()、二进制对数log2()、10进制对数log10()、平方根 sqrt()
向上取整ceil()、向下取整floor()、四舍五入round()
样本差idelta()、差值delta()、递增值increase()、重置次数resets()
递增率irate()、变化率rate()、平滑值holt_winters()、直方百分位histogram_quantile()
预测值predict_linear()、参数vector()
范围最小值min_over_time()、范围最大值max_over_time()、范围平均值avg_over_time()、
范围求和值sum_over_time()、范围计数值count_over_time()、范围分位数quantile_over_time()、
范围标准差stddev_over_time()、范围标准方差stdvar_over_time()
取样相关
获取样本absent()、升序sort()、降序sort_desc()、变化数changes()
判断值scalar()、判断大clamp_max()、判断小clamp_min()
范围采样值absent_over_time(),
时间相关
day_of_month()、day_of_week()、days_in_month()、hour()、minute()、month()、time()、 timestamp()、year()
标签相关
标签合并label_join()、标签替换labelreplace()
示例
ceil():向上取整
floor():向下取整
round():四舍五入
#示例
ceil(node_load15 * 10)
floor(node_load15 * 10)
round(node_load15 * 10)
increase(): 增长量,即last值-last前一个值
#示例:最近1分钟内CPU处于空闲状态时间
increase(node_cpu_seconds_total{cpu="0",mode="idle"}[1m])
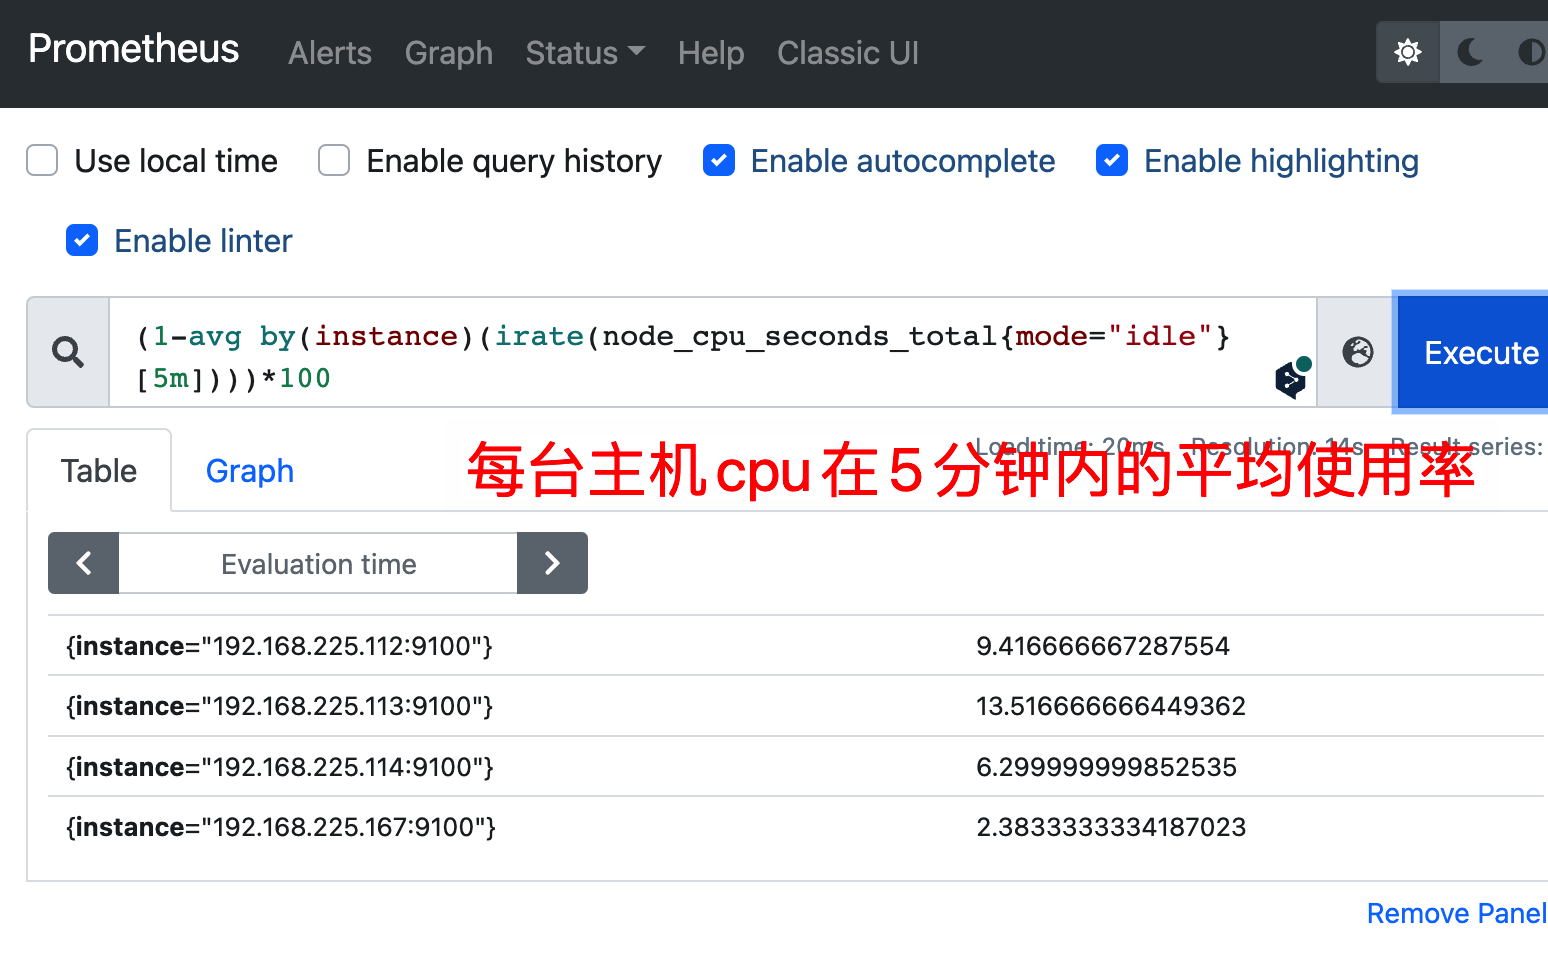
irate():查看瞬时变化率,即:(last值-last前一个值)/时间戳差值
#示例:查看CPU最近5m内最多的增长率
irate(node_cpu_seconds_total{instance="10.0.0.101:9100",mode="idle"}[5m])
rate():平均变化率,计算在指定时间范围内计数器每秒增加量的平均值,即(last值-first值)/时间差的秒 数
#示例:
#过去一分钟磁盘读的变化率
rate(node_disk_read_bytes_total[1m])
#一分钟内网卡传输的字节数(MB)
rate(node_network_transmit_bytes_total{device="eth0"}[1m]) /1024 /1024
time(): 获取当前时间值
#示例:
#计算当前每个主机的运行时间
(time() - node_boot_time_seconds) / 3600
#计算所有主机的总运行时间
sum(time() - node_boot_time_seconds) / 3600
histogram_quantile(): 百分取样值
#示例:
#计算过去10m内请求持续时间的第90个百分位数
histogram_quantile(0.9, rate(prometheus_http_request_duration_seconds_bucket[10m]))
(1-avg by(instance)(irate(node_cpu_seconds_total{mode="idle"}[5m])))*100
4. 定制Exporter
4.1 定制exporter说明
Prometheus对于监控功能的核心要素就是metric的监控项是否正常工作,metric是对应的服务启动 后,自动携带的一个url地址,通过该地址可以获取我们想要的监控项。
实际生产环境中,想要监控好多指标,但是prometheus 内置的环境中可能没有对应的metric监控项条 目,比如监控docker应用、监控系统服务、网页的转化率等,所以就需要实现自定义的metric条目。
开发应用服务的时候,就需要根据metric的数据格式,定制标准的/metric接口。 各种语言帮助手册:
https://github.com/prometheus/client_golang
https://github.com/prometheus/client_python
https://github.com/prometheus/client_java
https://github.com/prometheus/client_rust
以python项目,可以借助于prometheus_client模块在python类型的web项目中定制metric接口。
Three Step Demo
One: Install the client:
pip install prometheus-client
Two: Paste the following into a Python interpreter:
from prometheus_client import start_http_server, Summary
import random
import time
# Create a metric to track time spent and requests made.
REQUEST_TIME = Summary('request_processing_seconds', 'Time spent processing
request')
# Decorate function with metric.
@REQUEST_TIME.time()
def process_request(t):
"""A dummy function that takes some time."""
time.sleep(t)
if __name__ == '__main__':
# Start up the server to expose the metrics.
start_http_server(8000)
# Generate some requests.
while True:
process_request(random.random())
Three: Visit http://localhost:8000/ to view the metrics.
4.2 定制exporter 实战案例:python实现
4.2.1 准备python开发web环境
#apt安装python3.9
~# apt update
~# apt install -y python3.9 (可选)
~# apt install -y python3-pip
#############################如何不安装虚拟环境下面不需要执行 #################################
#安装虚拟环境软件
~# pip3 install pbr virtualenv
~# pip3 install --no-deps stevedore virtualenvwrapper
#创建用户
~# useradd -m -s /bin/bash python
#准备目录
~# mkdir -p /data/venv
~# chown python.python /data/venv
#修改配置文件(可选)
~# su - python
~# vim .bashrc
force_color_prompt=yes #取消此行注释,清加颜色显示
#配置加速
~# mkdir ~/.pip
~# vim .pip/pip.conf
[global]
index-url = https://pypi.tuna.tsinghua.edu.cn/simple [install]
trusted-host=pypi.douban.com
#配置虚拟软件
echo 'export WORKON_HOME=/data/venv' >> .bashrc
echo 'export VIRTUALENVWRAPPER_PYTHON=/usr/bin/python3' >> .bashrc
echo 'export VIRTUALENVWRAPPER_VIRTUALENV=/usr/local/bin/virtualenv' >> .bashrc echo 'source /usr/local/bin/virtualenvwrapper.sh' >> .bashrc
source .bashrc
#注意:virtualenv 和 virtualenvwrapper.sh 的路径位置
#创建新的虚拟环境并自动进入
~# mkvirtualenv -p python3 flask_env
#进入已创建的虚拟环境
~# su - python
~# workon flask_env
#虚拟环境中安装相关模块库
~# pip install flask prometheus_client
~# pip list
#################################如何不安装虚拟环境上面不需要执行 ##########################
#实际环境中安装相关模块库
~# pip3 install flask prometheus_client
~# pip3 list
#创建代码目录 ~# mkdir code
4.2.2 项目代码
代码说明
from prometheus_client import Counter, Gauge, Summary
from prometheus_client.core import CollectorRegistry
class Monitor:
def __init__(self):
# 注册收集器
self.collector_registry = CollectorRegistry(auto_describe=False)
# summary类型监控项设计
self.summary_metric_name = Summary(name="summary_metric_name",
documentation="summary_metric_desc",
labelnames=("label1", "label2", "label3"),
registry=self.collector_registry)
# gauge类型监控项设计
self.gauge_metric_name = Gauge(name="gauge_metric_name",
documentation="summary_gauge_desc",
labelnames=("method", "code", "uri"),
registry=self.collector_registry)
# counter类型监控项设计
self.counter_metric_name = Counter(name="counter_metric_name",
documentation="summary_counter_desc",
labelnames=("method", "code", "uri"),
registry=self.collector_registry)
#属性解析:上面是几个常用的标准metric数据格式设计,
范例:定制flask web项目
]# su - python
]# workon flask_env
]# cat ~/code/flask_metric.py
from prometheus_client import start_http_server,Counter, Summary
from flask import Flask, jsonify
from wsgiref.simple_server import make_server
import time
app = Flask(__name__)
# Create a metric to track time spent and requests made
REQUEST_TIME = Summary('request_processing_seconds', 'Time spent processing
request')
COUNTER_TIME = Counter("request_count", "Total request count of the host")
@app.route("/metrics")
@REQUEST_TIME.time()
def requests_count():
COUNTER_TIME.inc()
return jsonify({"return": "success OK!"})
if __name__ == "__main__":
start_http_server(8000)
httpd = make_server( '0.0.0.0', 8001, app )
httpd.serve_forever()
#代码解析:
.inc() 表示递增值为 1
start_http_server(8000) #收集数据的端口 可以通过8000/metrics收集日志
make_sever( '0.0.0.0', 8001, app ) #表示另开启一个web服务的/metrics 链接专门用于接收请 求。
#启动项目:
]# python flask_meric.py
#浏览器访问 10.0.0.101:8000/metrics 可以看到大量的监控项,下面的几项就是我们自己定制的 ...
# HELP request_processing_seconds Time spent processing request
# TYPE request_processing_seconds summary
request_processing_seconds_count 0.0
request_processing_seconds_sum 0.0
# TYPE request_processing_seconds_created gauge request_processing_seconds_created 1.5851566329768722e+09
# HELP request_count_total Total request count of the host
# TYPE request_count_total counter
request_count_total 0.0
# TYPE request_count_created gauge
request_count_created 1.5851566329769313e+09
当访问 10.0.0.101:8001/metrics 时,每刷新一次 10.0.0.101:8000/metrics的request_cont_toal值就会增加1
#如果希望持续性的进行接口访问的话,我们可以编写一个脚本来实现: # cat curl_metrics.sh
#!/bin/bash
# 获取随机数
while true;do
sleep_num=$(($RANDOM%3+1))
curl_num=$(($RANDOM%50+1))
for c_num in `seq $curl_num`
do
curl -s http://10.0.0.101:8001/metrics >>/dev/null 2>&1
done
sleep $sleep_num
done
4.2.3 prometheus集成
修改prometheus配置, 增加job任务
]# vim /usr/local/prometheus/conf/prometheus.yml
...
- job_name: 'my_metric'
static_configs:
- targets:
- "10.0.0.101:8000"
- "10.0.0.102:8000"
labels: {app: "flask_web"}
#属性解析:我们增加了一个自定义的metric的job目标 #检查语法
]#promtool check config /usr/local/prometheus/conf/prometheus.yml
#重启prometheus服务
]# systemctl restart prometheus.service
浏览器访问prometheus的target界面
4.3 定制exporter 实战案例:golang实现
基于golang实现
#先安装go环境 略
#利用SDK实现
#cat main.go package main
import (
"net/http"
"github.com/prometheus/client_golang/prometheus/promhttp"
)
func main() {
// Serve the default Prometheus metrics registry over HTTP on /metrics.
http.Handle("/metrics", promhttp.Handler())
http.ListenAndServe(":9527", nil)
}
SET CGO_ENABLED=0
SET GOOS=linux
SET GOARCH=amd64
go mod init
go run main.go
go build -o exporter_demo
./exporter_demo
curl http://127.0.0.1:9527/metrics
# HELP go_gc_cycles_automatic_gc_cycles_total Count of completed GC cycles
generated by the Go runtime.
# TYPE go_gc_cycles_automatic_gc_cycles_total counter
go_gc_cycles_automatic_gc_cycles_total 0
# HELP go_gc_cycles_forced_gc_cycles_total Count of completed GC cycles forced by
the application.
# TYPE go_gc_cycles_forced_gc_cycles_total counter
go_gc_cycles_forced_gc_cycles_total 0
# HELP go_gc_cycles_total_gc_cycles_total Count of all completed GC cycles.
# TYPE go_gc_cycles_total_gc_cycles_total counter
go_gc_cycles_total_gc_cycles_total 0
# HELP go_gc_duration_seconds A summary of the pause duration of garbage
collection cycles.


 92
92


 被折叠的 条评论
为什么被折叠?
被折叠的 条评论
为什么被折叠?
 到【灌水乐园】发言


