


Springboot启动耗时监控
1、在run方法的第一步执行就是记录启动的耗时
	StopWatch stopWatch = new StopWatch();
	stopWatch.start();
stopWatch.start()和stopWatch.stop()是成对出现的,这之间的部分就是StopWatch监控的事件,主要用于监控执行时长
2、在stopWatch.stop()执行之后会有一段打印启动日志的代码,我们可以继续跟进,然后看看静静做了些什么
stopWatch.stop();
if (this.logStartupInfo) {
	new StartupInfoLogger(this.mainApplicationClass).logStarted(getApplicationLog(), stopWatch);
}
3、其他代码直接路过,我们跟踪这块代码
new StartupInfoLogger(this.mainApplicationClass).logStarted(getApplicationLog(), stopWatch);
初始化对象这个代码不看,主要看logStarted方法
这个方法有2个参数
- 第一个参数是一个Log对象
getApplicationLog()获取到了,这里的代码很简单LogFactory.getLog不做太多解读- 第二个参数是一个stopWatch
进入这个方法之后我们就看到这个方法的逻辑
void logStarted(Log applicationLog, StopWatch stopWatch) {
	if (applicationLog.isInfoEnabled()) {
		applicationLog.info(getStartedMessage(stopWatch));
	}
}
从这里可以猜到,这段代码主要就是打印启动耗时日志的getStartedMessage方法应该就是拼接一段日志
private CharSequence getStartedMessage(StopWatch stopWatch) {
	StringBuilder message = new StringBuilder();
	message.append("Started ");
	appendApplicationName(message);
	message.append(" in ");
	message.append(stopWatch.getTotalTimeMillis() / 1000.0);
	message.append(" seconds");
	try {
		double uptime = ManagementFactory.getRuntimeMXBean().getUptime() / 1000.0;
		message.append(" (JVM running for ").append(uptime).append(")");
	}
	catch (Throwable ex) {
		// No JVM time available
	}
	return message;
}
看到这段代码,彻底的验证了我们的想法是正确的,这段代码就是在评价一个字符串,作为上一个方法的输出内容
我们从启动日志最终也看到了日志的打印内容,就是我们getStartedMessage运算之后的结果
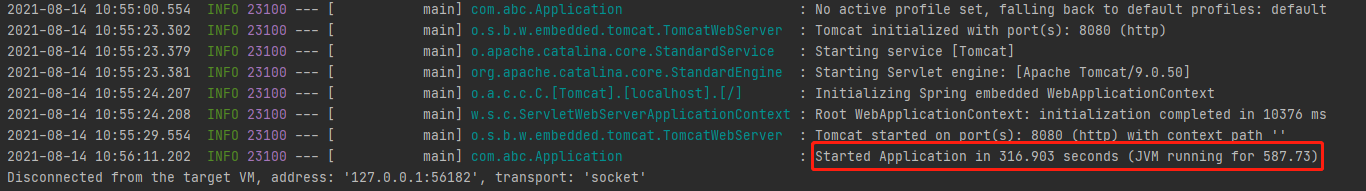
com.abc.Application : Started Application in 316.903 seconds (JVM running for 587.73)


 616
616


 被折叠的 条评论
为什么被折叠?
被折叠的 条评论
为什么被折叠?
 到【灌水乐园】发言


