


Java绘制图表(柱状图、饼图、折线图(时间序列操作)):开放的图表绘制类库JfreeChart(Struts2篇)
操作步骤:
1、新建Dynamic Web项目。
2、导入JFreeChart所需的jar包和Struts2所需的jar包。
3、配置web.xml文件,添加Struts2核心过滤器。
4、编写生成图表的Action类。
5、配置struts.xml文件(该配置文件位于src下,文件名不能被更改)
6、新建jsp页面请求action。
7、部署该项目到tomcat服务器,在浏览器请求jsp页面即可。
实例1:LineChart(折线图)
1、新建Dynamic Web项目。
关于web项目创建后WEB-INF下面没有出现web.xml的解决方法https://blog.csdn.net/weixin_43209201/article/details/86607913
2、导入所需的jar包。
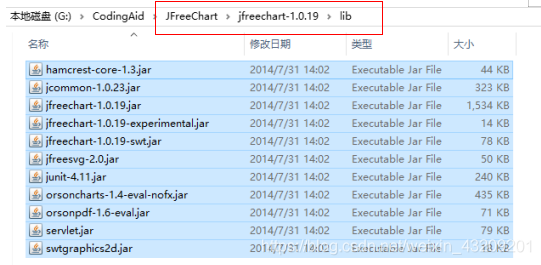
- JFreeChartjar包下载地址:https://sourceforge.net/projects/jfreechart/files/
下载的压缩包解压后在下图所示路径寻找jar包:
- 如何快速找到Struts2所需要的基本jar包:https://blog.csdn.net/weixin_43209201/article/details/86544691
将jar包导入项目中(复制粘贴即可),有的jar包可能用不到,为了方便这几全部导入了:
 注意:要导入Struts2关于JFreeChart的插件包,插件包在Struts2的lib目录下可以找到,如图中所示:

3、配置web.xml文件,添加Struts2核心过滤器。代码如下:
<?xml version="1.0" encoding="UTF-8"?>
<web-app xmlns:xsi="http://www.w3.org/2001/XMLSchema-instance"
	xmlns="http://xmlns.jcp.org/xml/ns/javaee"
	xsi:schemaLocation="http://xmlns.jcp.org/xml/ns/javaee http://xmlns.jcp.org/xml/ns/javaee/web-app_4_0.xsd"
	version="4.0">
	<display-name>Struts2_ExcelOperation_Demo</display-name>
	<welcome-file-list>
		<welcome-file>index.html</welcome-file>
		<welcome-file>index.htm</welcome-file>
		<welcome-file>index.jsp</welcome-file>
		<welcome-file>default.html</welcome-file>
		<welcome-file>default.htm</welcome-file>
		<welcome-file>default.jsp</welcome-file>
	</welcome-file-list>

	<filter>
		<filter-name>Struts2</filter-name>
		<filter-class>org.apache.struts2.dispatcher.ng.filter.StrutsPrepareAndExecuteFilter</filter-class>
	</filter>
	<filter-mapping>
		<filter-name>Struts2</filter-name>
		<url-pattern>/*</url-pattern>
	</filter-mapping>
	<!-- 作用:接管请求。将请求交给struts2来处理 -->
<!-- 注意:不同版本的核心过滤器不一样
            2.1以前是org.apache.struts2.dispatcher.FilterDispatcher
            2.1以后org.apache.struts2.dispatcher.ng.filter.StrutsPrepareAndExecuteFilter
-->

</web-app>
4、编写生成图表的Action类。代码如下:
package action;

import java.awt.Font;

import org.jfree.chart.ChartFactory;
import org.jfree.chart.JFreeChart;
import org.jfree.chart.StandardChartTheme;
import org.jfree.chart.axis.DateAxis;
import org.jfree.chart.axis.DateTickUnit;
import org.jfree.chart.labels.ItemLabelAnchor;
import org.jfree.chart.labels.ItemLabelPosition;
import org.jfree.chart.labels.StandardXYItemLabelGenerator;
import org.jfree.chart.plot.XYPlot;
import org.jfree.chart.renderer.xy.XYItemRenderer;
import org.jfree.chart.renderer.xy.XYLineAndShapeRenderer;
import org.jfree.chart.title.TextTitle;
import org.jfree.data.time.Month;
import org.jfree.data.time.TimeSeries;
import org.jfree.data.time.TimeSeriesCollection;
import org.jfree.ui.TextAnchor;

import com.opensymphony.xwork2.ActionSupport;

public class LineChartAction extends ActionSupport {

	/**
	 *
	 */
	private static final long serialVersionUID = 1L;

	private JFreeChart chart;

	public JFreeChart getChart() {
		return chart;
	}

	public void setChart(JFreeChart chart) {
		this.chart = chart;
	}

	@Override
	public String execute() throws Exception {
		/**
		 * 以下代码通过设置主题样式解決中文乱码问题
		 */
		// 创建主题样式
		StandardChartTheme standardChartTheme = new StandardChartTheme("CN");
		// 设置标题字体
		standardChartTheme.setExtraLargeFont(new Font("隶书", Font.BOLD, 20));
		// 设置图例的字体
		standardChartTheme.setRegularFont(new Font("宋书", Font.PLAIN, 15));
		// 设置轴向的字体
		standardChartTheme.setLargeFont(new Font("宋书", Font.PLAIN, 15));
		// 应用主题样式
		ChartFactory.setChartTheme(standardChartTheme);
		// 访问量统计
		TimeSeries timeSeries = new TimeSeries("A网站访问量统计", Month.class);
		// 添加数据
		timeSeries.add(new Month(1, 2013), 100);
		timeSeries.add(new Month(2, 2013), 200);
		timeSeries.add(new Month(3, 2013), 300);
		timeSeries.add(new Month(4, 2013), 400);
		timeSeries.add(new Month(5, 2013), 560);
		timeSeries.add(new Month(6, 2013), 600);
		timeSeries.add(new Month(7, 2013), 750);
		timeSeries.add(new Month(8, 2013), 890);
		timeSeries.add(new Month(9, 2013), 120);
		timeSeries.add(new Month(10, 2013), 400);
		timeSeries.add(new Month(11, 2013), 1200);
		timeSeries.add(new Month(12, 2013), 1600);

		// 访问量统计
		TimeSeries timeSeries2 = new TimeSeries("B网站访问量统计", Month.class);
		// 添加数据
		timeSeries2.add(new Month(1, 2013), 50);
		timeSeries2.add(new Month(2, 2013), 100);
		timeSeries2.add(new Month(3, 2013), 150);
		timeSeries2.add(new Month(4, 2013), 200);
		timeSeries2.add(new Month(5, 2013), 220);
		timeSeries2.add(new Month(6, 2013), 300);
		timeSeries2.add(new Month(7, 2013), 340);
		timeSeries2.add(new Month(8, 2013), 400);
		timeSeries2.add(new Month(9, 2013), 450);
		timeSeries2.add(new Month(10, 2013), 500);
		timeSeries2.add(new Month(11, 2013), 70);
		timeSeries2.add(new Month(12, 2013), 800);

		// 定义时间序列的集合
		TimeSeriesCollection lineDataset = new TimeSeriesCollection();
		lineDataset.addSeries(timeSeries);
		lineDataset.addSeries(timeSeries2);

		chart = ChartFactory.createTimeSeriesChart("访问量统计时间折线图", "月份", "访问量", lineDataset, true, true, true);

		// 设置主标题
		chart.setTitle(new TextTitle("A,B网站访问量统计对比图", new Font("隶书", Font.ITALIC, 15)));
		// 设置子标题
		TextTitle subtitle = new TextTitle("2018年度", new Font("黑体", Font.BOLD, 12));
		chart.addSubtitle(subtitle);
		chart.setAntiAlias(true);

		// 设置时间轴的范围。
		XYPlot plot = (XYPlot) chart.getPlot();
		DateAxis dateaxis = (DateAxis) plot.getDomainAxis();
		dateaxis.setDateFormatOverride(new java.text.SimpleDateFormat("M月"));
		dateaxis.setTickUnit(new DateTickUnit(DateTickUnit.MONTH, 1));

		// 设置曲线是否显示数据点
		XYLineAndShapeRenderer xylinerenderer = (XYLineAndShapeRenderer) plot.getRenderer();
		xylinerenderer.setBaseShapesVisible(true);

		// 设置曲线显示各数据点的值
		XYItemRenderer xyitem = plot.getRenderer();
		xyitem.setBaseItemLabelsVisible(true);
		xyitem.setBasePositiveItemLabelPosition(
				new ItemLabelPosition(ItemLabelAnchor.OUTSIDE12, TextAnchor.BASELINE_CENTER));
		xyitem.setBaseItemLabelGenerator(new StandardXYItemLabelGenerator());
		xyitem.setBaseItemLabelFont(new Font("Dialog", 1, 12));
		plot.setRenderer(xyitem);

		return SUCCESS;
	}

}
5、配置struts.xml文件(该配置文件位于src下,文件名不能被更改)。代码如下:
<?xml version="1.0" encoding="UTF-8"?>
<!DOCTYPE struts PUBLIC
    "-//Apache Software Foundation//DTD Struts Configuration 2.3//EN"
    "http://struts.apache.org/dtds/struts-2.3.dtd">

<struts>

	<package name="jfreechart" extends="jfreechart-default">
		<action name="lineChart" class="action.LineChartAction">
			<result name="success" type="chart">
				<param name="value">chart</param>
				<param name="type">png</param>
				<param name="width">700</param>
				<param name="height">500</param>
			</result>
		</action>
	</package>


</struts>
6、新建jsp页面请求action。
<%@ page language="java" contentType="text/html; charset=UTF-8"
    pageEncoding="UTF-8"%>
<!DOCTYPE html>
<html>
<head>
<meta charset="UTF-8">
<title>Insert title here</title>
</head>
<body>
<img src="lineChart"/>
</body>
</html>
7、部署该项目到tomcat服务器,在浏览器请求jsp页面即可。


 388
388


 被折叠的 条评论
为什么被折叠?
被折叠的 条评论
为什么被折叠?
 到【灌水乐园】发言


