public Form1()
{
    InitializeComponent();
    chartStyle(); //统计图样式
}
void chartStyle()
{
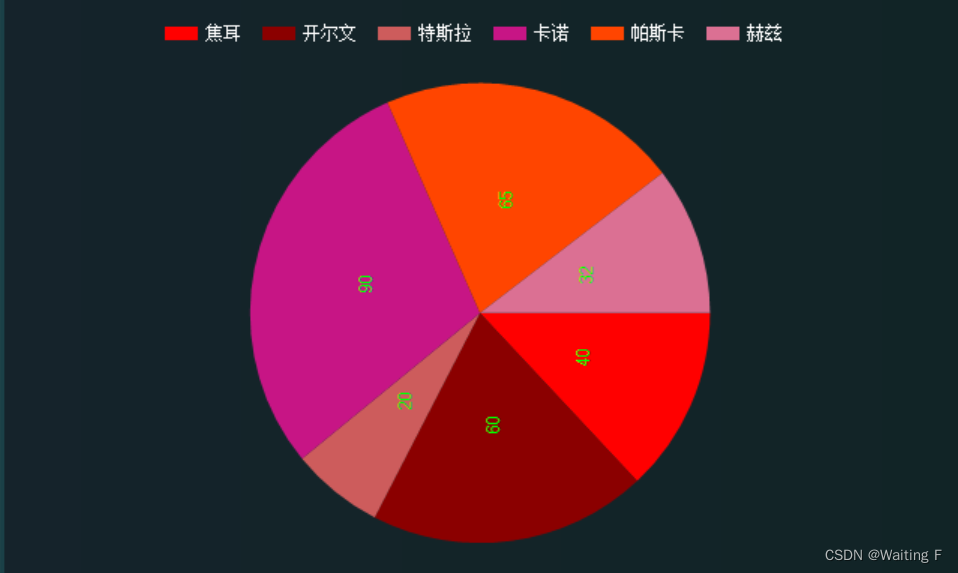
chart3.Series.Clear();
ChartHelper.AddSeries(chart3, "饼状图", SeriesChartType.Pie, Color.Lime, Color.Red, true);
ChartHelper.SetStyle(chart3, Color.Transparent, Color.White);
ChartHelper.SetLegend(chart3, Docking.Top, StringAlignment.Center, Color.Transparent, Color.White);
RefreshData();
}
public void RefreshData()
{
dataValues = CReadExcel.ReadExcelData(m_TableName2);
RefreshChart(dataValues, "chart2");
}
public delegate void RefreshChartDelegate(List<DataValue> values, string type);
public void RefreshChart(List<DataValue> values, string type)
{
List<string> x = new List<string>();
List<double> y = new List<double>();
foreach (DataValue value in values)
{
x.Add(value.Name);
y.Add(Convert.ToDouble(value.Value));
}
if (type == "chart2")
{
if (this.chart3.InvokeRequired)
{
RefreshChartDelegate stcb = new RefreshChartDelegate(RefreshChart);
this.Invoke(stcb, new object[] { x, y, type });
}
else
{
chart3.Series[0].Points.DataBindXY(x, y);
List<Color> colors = new List<Color>() {
Color.Red,
Color.DarkRed,
Color.IndianRed,
Color.MediumVioletRed,
Color.OrangeRed,
Color.PaleVioletRed,
Color.Purple,
Color.DarkOrange,
Color.Maroon,
Color.LightCoral,
Color.LightPink,
Color.Magenta
};
DataPointCollection points = chart3.Series[0].Points;
for (int i = 0; i < points.Count; i++)
{
points[i].Color = colors[i];
}
}
}
}
}
 public class ChartHelper
 {
     /// <summary>
     /// Name:添加序列
     /// </summary>
     /// <param name="chart">图表对象</param>
     /// <param name="seriesName">序列名称</param>
     /// <param name="chartType">图表类型</param>
     /// <param name="color">颜色</param>
     /// <param name="markColor">标记点颜色</param>
     /// <param name="showValue">是否显示数值</param>
     public static void AddSeries(Chart chart, string seriesName, SeriesChartType chartType, Color color, Color markColor, bool showValue = false)
     {
         chart.Series.Add(seriesName);
         chart.Series[seriesName].ChartType = chartType;
         chart.Series[seriesName].Color = color;
         if (showValue)
         {
             chart.Series[seriesName].IsValueShownAsLabel = true;
             chart.Series[seriesName].MarkerStyle = MarkerStyle.Circle;
             chart.Series[seriesName].MarkerColor = markColor;
             chart.Series[seriesName].LabelForeColor = color;
             chart.Series[seriesName].LabelAngle = -90;
         }
     }

     /// <summary>
     /// Name:设置标题
     /// </summary>
     /// <param name="chart">图表对象</param>
     /// <param name="chartName">图表名称</param>
     public static void SetTitle(Chart chart, string chartName, Font font, Docking docking, Color foreColor)
     {
         chart.Titles.Add(chartName);
         chart.Titles[0].Font = font;
         chart.Titles[0].Docking = docking;
         chart.Titles[0].ForeColor = foreColor;
     }

     /// <summary>
     /// Name:设置样式
     /// </summary>
     /// <param name="chart">图表对象</param>
     /// <param name="backColor">背景颜色</param>
     /// <param name="foreColor">字体颜色</param>
     public static void SetStyle(Chart chart, Color backColor, Color foreColor)
     {
         chart.BackColor = backColor;
         chart.ChartAreas[0].BackColor = backColor;
         chart.ForeColor = Color.Red;
     }

     /// <summary>
     /// Name:设置图例
     /// </summary>
     /// <param name="chart">图表对象</param>
     /// <param name="docking">停靠位置</param>
     /// <param name="align">对齐方式</param>
     /// <param name="backColor">背景颜色</param>
     /// <param name="foreColor">字体颜色</param>
     public static void SetLegend(Chart chart, Docking docking, StringAlignment align, Color backColor, Color foreColor)
     {
         chart.Legends[0].Docking = docking;
         chart.Legends[0].Alignment = align;
         chart.Legends[0].BackColor = backColor;
         chart.Legends[0].ForeColor = foreColor;
     }

     /// <summary>
     /// Name:设置XY轴
     /// </summary>
     /// <param name="chart">图表对象</param>
     /// <param name="xTitle">X轴标题</param>
     /// <param name="yTitle">Y轴标题</param>
     /// <param name="align">坐标轴标题对齐方式</param>
     /// <param name="foreColor">坐标轴字体颜色</param>
     /// <param name="lineColor">坐标轴颜色</param>
     /// <param name="arrowStyle">坐标轴箭头样式</param>
     /// <param name="xInterval">X轴的间距</param>
     /// <param name="yInterval">Y轴的间距</param>
     public static void SetXY(Chart chart, string xTitle, string yTitle, StringAlignment align, Color foreColor, Color lineColor, AxisArrowStyle arrowStyle, double xInterval, double yInterval)
     {
         chart.ChartAreas[0].AxisX.Title = xTitle;
         chart.ChartAreas[0].AxisY.Title = yTitle;
         chart.ChartAreas[0].AxisX.TitleAlignment = align;
         chart.ChartAreas[0].AxisY.TitleAlignment = align;
         chart.ChartAreas[0].AxisX.TitleForeColor = foreColor;
         chart.ChartAreas[0].AxisY.TitleForeColor = foreColor;
         chart.ChartAreas[0].AxisX.LabelStyle = new LabelStyle() { ForeColor = foreColor };
         chart.ChartAreas[0].AxisY.LabelStyle = new LabelStyle() { ForeColor = foreColor };
         chart.ChartAreas[0].AxisX.LineColor = lineColor;
         chart.ChartAreas[0].AxisY.LineColor = lineColor;
         chart.ChartAreas[0].AxisX.ArrowStyle = arrowStyle;
         chart.ChartAreas[0].AxisY.ArrowStyle = arrowStyle;
         chart.ChartAreas[0].AxisX.Interval = xInterval;
         chart.ChartAreas[0].AxisY.Interval = yInterval;

         //chart.ChartAreas[0].Area3DStyle.Enable3D = true;
     }

     /// <summary>
     /// Name:设置网格
     /// </summary>
     /// <param name="chart">图表对象</param>
     /// <param name="lineColor">网格线颜色</param>
     /// <param name="xInterval">X轴网格的间距</param>
     /// <param name="yInterval">Y轴网格的间距</param>
     public static void SetMajorGrid(Chart chart, Color lineColor, double xInterval, double yInterval)
     {
         chart.ChartAreas[0].AxisX.MajorGrid.LineColor = lineColor;
         chart.ChartAreas[0].AxisY.MajorGrid.LineColor = lineColor;
         chart.ChartAreas[0].AxisX.MajorGrid.Interval = xInterval;
         chart.ChartAreas[0].AxisY.MajorGrid.Interval = yInterval;
     }


 }


 1343
1343


 被折叠的 条评论
为什么被折叠?
被折叠的 条评论
为什么被折叠?
 到【灌水乐园】发言


