


SRE笔记 2022.9.28&9.30 网络相关命令
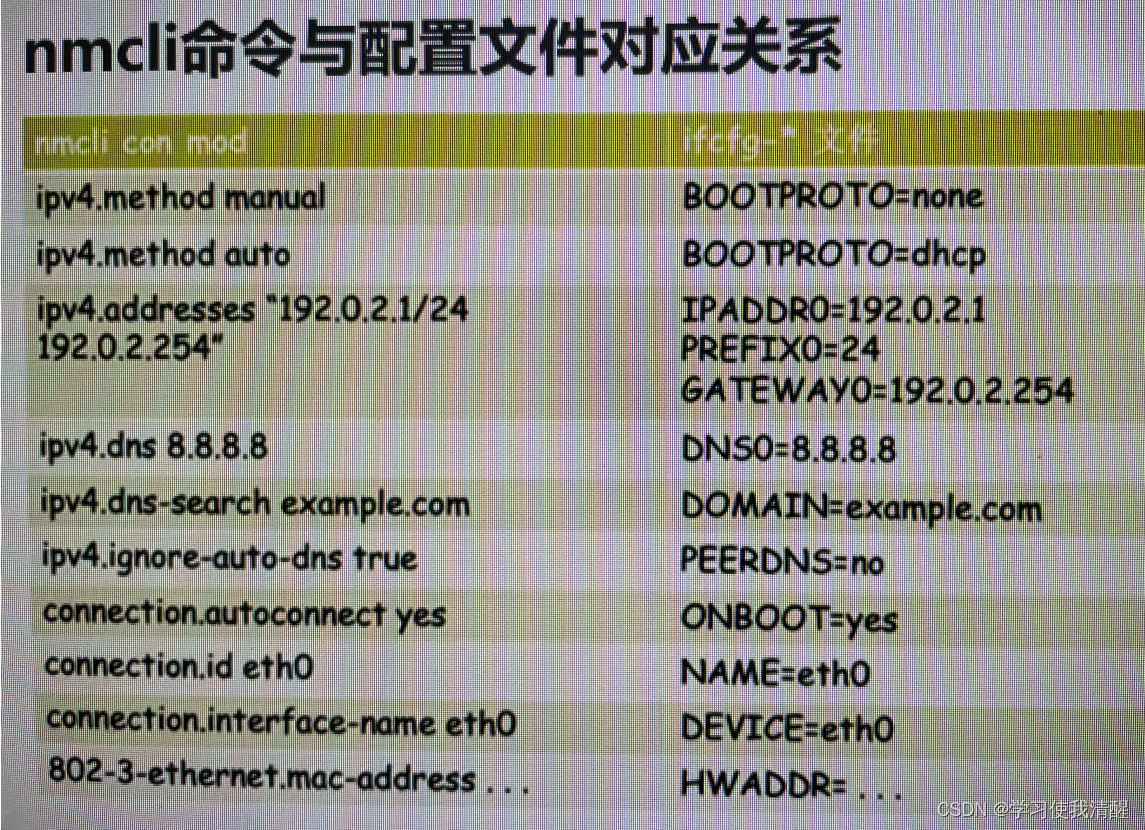
nmcli命令
- 管理NetworkManager命令工具(c7尽量不用,熟悉即可)
- nmcli 关闭和启用网卡,查询网卡信息
[root@aaa ~]# nmcli connection # 查询网卡信息
NAME  UUID                                  TYPE      DEVICE
eth0  15cb1f41-e5ea-4dd7-a199-e9ee861eba23  ethernet  eth0
eth1  314a6c0a-5b90-47c0-91ca-e5bdba46a5d7  ethernet  eth1
eth1  bed41c75-7b05-44ac-a646-1f94fa05962d  ethernet  --
[root@aaa ~]# nmcli c down eth1  # 关闭网卡
Connection 'eth1' successfully deactivated (D-Bus active path: /org/freedesktop/NetworkManager/ActiveConnection/2)
[root@aaa ~]# nmcli c up eth1   # 启动
Connection successfully activated (D-Bus active path: /org/freedesktop/NetworkManager/ActiveConnection/4)
- 重新加载
[root@aaa ~]# nmcli c reload eth1
- 添加DNS
[root@aaa ~]# nmcli c modify eth1 ipv4.dns 114.114.114.114
[root@aaa ~]# grep -i dns /etc/sysconfig/network-scripts/ifcfg-eth1
DNS1=114.114.114.114
- 添加第二个dns
v[root@aaa ~]# nmcli c modify eth1 +ipv4.dns 7.7.7.7
- 删除dns
[root@aaa ~]# nmcli c modify eth1 -ipv4.dns 114.114.114.114
[root@aaa ~]# grep -i dns /etc/sysconfig/network-scripts/ifcfg-eth1
- 添加网关
[root@aaa ~]# nmcli c modify eth1 ipv4.gateway 10.0.0.253
- 查看设备列表
[root@aaa ~]# nmcli d
DEVICE  TYPE      STATE      CONNECTION
eth0    ethernet  connected  eth0
eth1    ethernet  connected  eth1
lo      loopback  unmanaged  --
- 查看device列表
[root@aaa ~]# nmcli d show
GENERAL.DEVICE:                         eth0
GENERAL.TYPE:                           ethernet
GENERAL.HWADDR:                         00:0C:29:1F:1B:19
GENERAL.MTU:                            1500
GENERAL.STATE:                          100 (connected)
GENERAL.CONNECTION:                     eth0
GENERAL.CON-PATH:                       /org/freedesktop/NetworkManager/ActiveConnection/1
WIRED-PROPERTIES.CARRIER:               on
IP4.ADDRESS[1]:                         10.0.0.128/24
IP4.GATEWAY:                            10.0.0.254
IP4.ROUTE[1]:                           dst = 0.0.0.0/0, nh = 10.0.0.254, mt = 0
IP4.ROUTE[2]:                           dst = 10.0.0.0/24, nh = 0.0.0.0, mt = 0
IP4.ROUTE[3]:                           dst = 169.254.0.0/16, nh = 0.0.0.0, mt = 1002
IP4.ROUTE[4]:                           dst = 10.0.0.0/24, nh = 0.0.0.0, mt = 100
IP4.DNS[1]:                             192.168.100.3
IP4.DNS[2]:                             222.222.222.222
IP6.ADDRESS[1]:                         fe80::20c:29ff:fe1f:1b19/64
IP6.GATEWAY:                            --
IP6.ROUTE[1]:                           dst = fe80::/64, nh = ::, mt = 256
IP6.ROUTE[2]:                           dst = ff00::/8, nh = ::, mt = 256, table=255
IP6.ROUTE[3]:                           dst = fe80::/64, nh = ::, mt = 100
- 查看指定设备信息
[root@aaa ~]# nmcli d show eth1
GENERAL.DEVICE:                         eth1
GENERAL.TYPE:                           ethernet
GENERAL.HWADDR:                         00:0C:29:1F:1B:23
GENERAL.MTU:                            1500
GENERAL.STATE:                          100 (connected)
GENERAL.CONNECTION:                     eth1
GENERAL.CON-PATH:                       /org/freedesktop/NetworkManager/ActiveConnection/4
WIRED-PROPERTIES.CARRIER:               on
IP4.ADDRESS[1]:                         10.0.0.129/24
IP4.GATEWAY:                            10.0.0.254
IP4.ROUTE[1]:                           dst = 10.0.0.0/24, nh = 0.0.0.0, mt = 101
IP4.ROUTE[2]:                           dst = 0.0.0.0/0, nh = 10.0.0.254, mt = 101
IP4.DNS[1]:                             192.168.100.3
IP4.DNS[2]:                             222.222.222.222
IP6.ADDRESS[1]:                         fe80::cb2f:74b0:62d8:e25/64
IP6.GATEWAY:                            --
IP6.ROUTE[1]:                           dst = fe80::/64, nh = ::, mt = 101
IP6.ROUTE[2]:                           dst = ff00::/8, nh = ::, mt = 256, table=255
- 激活网卡
root@aaa ~]# nmcli d c eth1
Device 'eth1' successfully activated with 'bed41c75-7b05-44ac-a646-1f94fa05962d'.
- 关闭无线网络(NM默认启用无线网络)
[root@aaa ~]# nmcli r all off
- 开启NM托管
[root@aaa ~]# nmcli n on
- 查看NM托管状态
[root@aaa ~]# nmcli n
enabled
- 关闭NM托管 (谨慎执行,可能会导致断网,无法连接)
[root@aaa ~]# nmcli n off - 监听事件
[root@aaa ~]# nmcli m
- 查看NM本身状态
[root@aaa ~]# nmcli
eth0: connected to eth0
        "Intel 82545EM"
        ethernet (e1000), 00:0C:29:1F:1B:19, hw, mtu 1500
        ip4 default
        inet4 10.0.0.128/24
        route4 10.0.0.0/24
        route4 0.0.0.0/0
        inet6 fe80::4667:1113:8033:46d9/64
        route6 fe80::/64
        route6 ff00::/8

eth1: connected to eth1
        "Intel 82545EM"
        ethernet (e1000), 00:0C:29:1F:1B:23, hw, mtu 1500
        inet4 10.0.0.129/24
        route4 10.0.0.0/24
        route4 0.0.0.0/0
        inet6 fe80::cb2f:74b0:62d8:e25/64
        route6 fe80::/64
        route6 ff00::/8

lo: unmanaged
- 检测NM是否在线可用
Connecting............... 30s [online]
网卡故障案例
- C7 开启NETworkManager来带来的问题
- c7关闭networkmanager可能带来小问题,如nmtui无法使用
- connection ‘ens33’ is not availabe on device ens33 because device is strictly unmanaged
- 执行 dhclient ens33
- 执行 nmcli n on(NM托管未开启导致)
- centos 7不能启动网卡报no suitable device found for this connectiono错误
查看网卡状态命令 nestat
[root@aaa ~]# netstat -lntup | grep ssh
tcp        0      0 0.0.0.0:22              0.0.0.0:*               LISTEN      1437/sshd
tcp6       0      0 :::22                   :::*                    LISTEN      1437/sshd
- lsof查看
[root@aaa ~]# lsof -i :22
COMMAND  PID USER   FD   TYPE DEVICE SIZE/OFF NODE NAME
sshd    1437 root    3u  IPv4  21660      0t0  TCP *:ssh (LISTEN)
sshd    1437 root    4u  IPv6  21662      0t0  TCP *:ssh (LISTEN)
sshd    1444 root    3u  IPv4  21681      0t0  TCP bogon:ssh->bogon:60515 (ESTABLISHED)
sshd    2288 root    3u  IPv4  29952      0t0  TCP bogon:ssh->bogon:62417 (ESTABLISHED)
- 以上两种方式可已知端口查服务
netstat参数
- l 监听状态
- n 以数字显示
- t tcp协议
- u udp协议
- p 显示进程名
- a 所有状态
- r 显示路由
企业案例
- 查看网络连接数访问IP,计算访问次数,并做统计(可能是攻击,大量访问,或者搜索引擎公司爬网站)
[root@Nginx ~]# netstat -an | grep ESTAB | awk -F '[ :]+' '{print $(NF-2)}'|sort|uniq -c | sort -rn | head
      9 192.168.100.3
      2 211.95.50.57
      2 192.168.100.96
      2 192.168.100.95
      2 192.168.100.120
      1 192.168.100.101
[root@Nginx ~]# netstat -an | awk -F '[ :]+' '/ESTAB/{print $(NF-2)}'|sort|uniq -c | sort -rn | head
    160 192.168.100.3
      2 211.95.50.57
      2 192.168.1.73
      2 192.168.100.96
      2 192.168.100.95
      2 192.168.100.120
      1 192.168.100.101
- 查看每个状态下有多少连接,可通过awk数组完成
- awk一维数组框架 : awk ‘{定义和计算}END{输出展示}’
[root@Nginx ~]# netstat -an | awk -F '[ :]+' '/ESTAB/{print $(NF-2)}'| awk '{++S[$1]}END{for(k  in S) print k,S[k]}'
192.168.1.72 5
192.168.100.3 144
211.95.50.57 2
192.168.100.95 2
192.168.100.96 2
192.168.100.101 1
192.168.100.120 2
[root@Nginx ~]# netstat -an | awk -F "[ :]+" '/'ESTAB.$'/{++S[$(NF-2)]}END{for(a in S) print S[a],a}'|sort -rn -k 2
2 211.95.50.57
91 192.168.100.3
2 192.168.100.96
2 192.168.100.95
2 192.168.100.120
2 192.168.100.101
1 192.168.1.73
1 192.168.1.72
1 10.0.59.12
- awk按行读取,++S[$1] 代表碰到第一列的一个IP计数为1,$1代表第一列,依次累加。END后是固定写法,k可随便写,print后 k和S(k)的位置可调换
- 获取每个IP不同连接状态的连接数,把每个IP和连接状态合并一起,整合成一个$1,然后再用awk数组计数
[root@Nginx ~]# netstat -an | awk -F "[ :]+" '/^tcp/{print $(NF-1)"|"$(NF-3)}'|grep -v '^[0-9]'|awk '{++S[$1]}END{for(a in S) print a,S[a]}'
LAST_ACK|192.168.100.3 1
CLOSE_WAIT|192.168.100.95 1
LISTEN|25 1
LISTEN|31768 1
FIN_WAIT2|192.168.1.72 1
CLOSE_WAIT|49.7.50.37 2
LISTEN|0.0.0.0 6
LISTEN|111 1
TIME_WAIT|192.168.1.72 436
LISTEN|52704 1
TIME_WAIT|192.168.1.73 437
LISTEN|22 1
- 由于筛选出来的状态包含数字的,中间用grep过滤了一下。
ss命令
- 同netstat
- x unix sock相关
- e 扩展的信息
- s 显示sockets摘要
- r 解析服务名称
- m 显示内存情况
企业示例
-
CDN加速,正常100M的带宽,突然几个小时增加了几百兆,如何解决?
-
查看监控流量图,发现问题
-
知道访问日志
-
awk数组 访问次数,访问次数*单个文件大小 文件名
-
找到总量大的,把图片减小,CDN推送更新
-
IDC带宽被占满的原因有很多,如
-
1 真实遭受DDOS攻击
-
2 内部服务器中毒,大量外发流量
-
3 网站元素(如图片)被盗链,在门户界面被推广
-
4 合作公司抓数据 ,对合作单位提供了API数据接口
-
4 购买了CDN业务,CDN猛抓源站
lsof命令
参数
- -a :列出打开文件存在的进程
- - c [进程名] 列出指定进程所打开的文件 :lsof - c abc
- -\ g 列出GID号进程详情 lsof -g gid
- -d[文件号] 列出占用该文件号的进程 lsof -d 4 显示使用fd为4的进程
- +d[目录] 列出目录下被打开的文件 lsof +d /usr/local
- +D[目录] 递归列出目录下被打开的文件 lsof +D /usr/local
- -n[目录] 列出使用NFS的文件
- -i [条件] 列出符合条件的进程
- -p [进程号] 列出指定进程号所打开的文件 : lsof -p 1234
- -u 列出UID号进程详情
- -h 显示帮助信息
- -v 显示版本信息
演示
- lsof 默认打开所有进程打开的所有文件
-i
[root@aaa ~]# lsof -i :22
COMMAND  PID USER   FD   TYPE DEVICE SIZE/OFF NODE NAME
sshd    1425 root    3u  IPv4  19446      0t0  TCP *:ssh (LISTEN)
sshd    1425 root    4u  IPv6  19448      0t0  TCP *:ssh (LISTEN)
sshd    1487 root    3u  IPv4  21241      0t0  TCP bogon:ssh->bogon:52067 (ESTABLISHED)
-c
[root@aaa ~]#lsof -c sshd
COMMAND  PID USER   FD   TYPE             DEVICE SIZE/OFF     NODE NAME
sshd    1425 root  cwd    DIR              253,0     4096       64 /
sshd    1425 root  rtd    DIR              253,0     4096       64 /
sshd    1425 root  txt    REG              253,0   852888   505878 /usr/sbin/sshd
sshd    1425 root  mem    REG              253,0    61560    35017 /usr/lib64/libnss_files-2.17.so
sshd    1425 root  mem    REG              253,0    68192    59052 /usr/lib64/libbz2.so.1.0.6
sshd    1425 root  mem    REG              253,0    99944    59047 /usr/lib64/libelf-0.176.so
-p
[root@aaa ~]# lsof -p 22
COMMAND   PID USER   FD      TYPE DEVICE SIZE/OFF NODE NAME
watchdog/  22 root  cwd       DIR  253,0     4096   64 /
watchdog/  22 root  rtd       DIR  253,0     4096   64 /
watchdog/  22 root  txt   unknown                      /proc/22/exe
-u
[root@aaa ~]# lsof -u root
COMMAND    PID USER   FD      TYPE             DEVICE  SIZE/OFF       NODE NAME
systemd      1 root  cwd       DIR              253,0      4096         64 /
systemd      1 root  rtd       DIR              253,0      4096         64 /
systemd      1 root  txt       REG              253,0   1632960   16951266 /usr/lib/systemd/systemd
systemd      1 root  mem       REG              253,0     20064      36507 /usr/lib64/libuuid.so.1.3.0
企业案例
- 磁盘满了,删除了一个文件,发现删错了,怎么找回来(注意,不同文件系统的恢复工具也不同。)
- 静态文件被删 etx3grep, debugfs(试用ext3文件系统)
- 动态文件被删 lsof
lsof恢复
- 模拟演示,创建文件,模拟动态调用
[root@aaa ~]# seq 10 > a.txt
[root@aaa ~]#
[root@aaa ~]# tail -f a.txt
1
2
3
4
5
6
7
8
9
10
- 删除文件
[root@aaa ~]# rm -f a.txt
- 查看tail 进程ID
[root@aaa ~]# ps -ef | grep tail
root       2376   2184  0 19:51 pts/1    00:00:00 tail -f a.txt
root       2396   1491  0 19:53 pts/0    00:00:00 grep --color=auto tail
- 执行lsof命令,会显示出已删除的文件
[root@aaa ~]# ps aux | head -n 1
USER        PID %CPU %MEM    VSZ   RSS TTY      STAT START   TIME COMMAND
[root@aaa ~]# ps aux | grep tail
root       2376  0.0  0.0   4404   360 pts/1    S+   19:51   0:00 tail -f a.txt
root       2434  0.0  0.0   9092   680 pts/0    S+   19:55   0:00 grep --color=auto tail
[root@aaa ~]# lsof -p 2376
COMMAND  PID USER   FD      TYPE DEVICE SIZE/OFF     NODE NAME
tail    2376 root  cwd       DIR  253,0     4096 33574977 /root
tail    2376 root  rtd       DIR  253,0     4096       64 /
tail    2376 root  txt       REG  253,0    66816 50896571 /usr/bin/tail
tail    2376 root  mem       REG  253,0  2156592    34950 /usr/lib64/libc-2.17.so
tail    2376 root  mem       REG  253,0   163312      825 /usr/lib64/ld-2.17.so
tail    2376 root    0u      CHR  136,1      0t0        4 /dev/pts/1
tail    2376 root    1u      CHR  136,1      0t0        4 /dev/pts/1
tail    2376 root    2u      CHR  136,1      0t0        4 /dev/pts/1
tail    2376 root    3r      REG  253,0       21 34668681 /root/a.txt (deleted)   # 已被删除
tail    2376 root    4r  a_inode   0,10        0     8534 inotify
或者直接
[root@aaa ~]# lsof -c tail
COMMAND  PID USER   FD      TYPE DEVICE SIZE/OFF     NODE NAME
tail    2376 root  cwd       DIR  253,0     4096 33574977 /root
tail    2376 root  rtd       DIR  253,0     4096       64 /
tail    2376 root  txt       REG  253,0    66816 50896571 /usr/bin/tail
tail    2376 root  mem       REG  253,0  2156592    34950 /usr/lib64/libc-2.17.so
tail    2376 root  mem       REG  253,0   163312      825 /usr/lib64/ld-2.17.so
tail    2376 root    0u      CHR  136,1      0t0        4 /dev/pts/1
tail    2376 root    1u      CHR  136,1      0t0        4 /dev/pts/1
tail    2376 root    2u      CHR  136,1      0t0        4 /dev/pts/1
tail    2376 root    3r      REG  253,0       21 34668681 /root/a.txt (deleted)
tail    2376 root    4r  a_inode   0,10        0     8534 inotify
- 进入proc目录,fd是文件描述符的意思
root@aaa ~]# cd /proc/2376/fd
[root@aaa fd]# ls -l
total 0
lrwx------. 1 root root 64 Sep 30 19:56 0 -> /dev/pts/1
lrwx------. 1 root root 64 Sep 30 19:56 1 -> /dev/pts/1
lrwx------. 1 root root 64 Sep 30 19:53 2 -> /dev/pts/1
lr-x------. 1 root root 64 Sep 30 19:56 3 -> /root/a.txt (deleted)  # 文件已被删除,但是inode未释放
lr-x------. 1 root root 64 Sep 30 19:56 4 -> anon_inode:inotify
- 恢复
[root@aaa fd]# cat 3 > /root/b.txt
[root@aaa fd]# cat /root/b.txt
1
2
3
4
5
6
7
8
9
10
文件描述符
- 内核(kernel)利用文件描述符(file descriptor)来访问文件。文件描述符是非负整数。打开现存文件或新建文件时,内核会返回一个文件描述符。读写文件也需要使用文件描述符来指定待读写的文件。
文件描述符设置
系统级设置
- 查看上限
- sysctl -a | grep ‘fs.file-max’
- 查看使用情况
- fs.file-nr (c7未使用成功)
- 修改上限
[root@aaa ~]# echo 'fs.file-max=65536;'>> /etc/sysc
sysconfig/   sysctl.conf  sysctl.d/
[root@aaa ~]# echo 'fs.file-max=65536;'>> /etc/sysctl.conf
[root@aaa ~]# sysctl  -p
vm.swappiness = 5
sysctl: setting key "fs.file-max": Invalid argument
fs.file-max = 65536;
或
进程级别的设置
- 打开文件的最大数量
- 查看上限
[root@aaa fd]# ulimit -n
1024
- 查看使用情况
lsof - 修改
修改 /etc/security/limits.conf文件,
* hard nofile 65535
* soft nofile 65535 - 保存退出后重新登录,其最大文件描述符已经被永久更改。
生产设置最大文件描述符
- 如果进程过多,进程打开数量受限,影响系统
- 在 /etc/security/limits.conf最后一行插入
-
- nofile 65535
- 保存退出,重新登录生效
fping 命令
- ping的加强版,是zabbix监控软件带的,需要安装
- 可探测广播域内所有主机
- a 显示存活主机
- -u不显示存活主机
- -l 循环ping
- -g 指定范围
traceroute 路由跟踪
- traceroute需要安装 c7可用tracepath
[root@aaa ~]# traceroute -n baidu.com
traceroute to baidu.com (110.242.68.66), 30 hops max, 60 byte packets
 1  10.0.0.254  0.134 ms  0.046 ms  0.027 ms
 2  * * *
 3  * * *
 4  * * *
 5  * * *
 6  * * *
 7  *^C
或
[root@aaa ~]# tracepath -n 192.168.10.1
 1?: [LOCALHOST]                                         pmtu 1500
 1:  10.0.0.254                                            0.274ms
 1:  10.0.0.254                                            0.228ms
 2:  no reply
^C
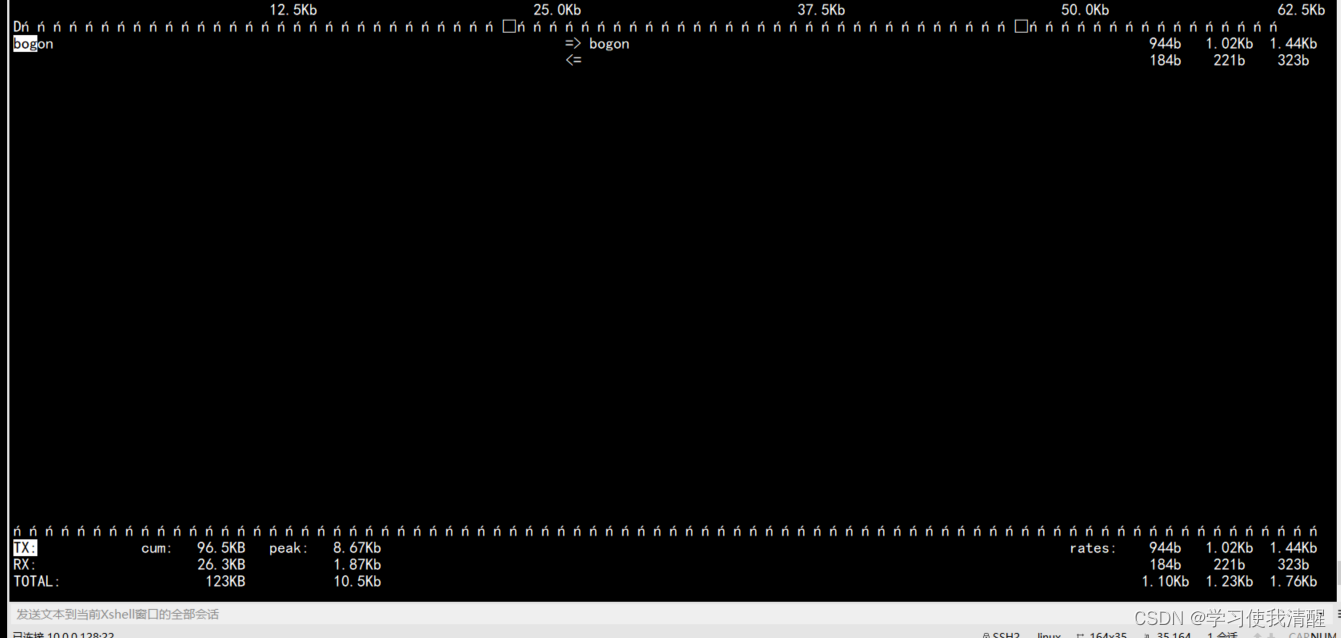
iftop命令
- 查看带宽(了解)
[root@aaa ~]# iftop
Nmap命令
- 探测端口,类似telnet
root@aaa ~]# nmap 10.0.61.61 -p 3389  # 常用shell脚本判断

Starting Nmap 6.40 ( http://nmap.org ) at 2022-09-30 22:08 CST
Nmap scan report for 10.0.61.61
Host is up (0.0018s latency).
PORT     STATE SERVICE
3389/tcp open  ms-wbt-server

Nmap done: 1 IP address (1 host up) scanned in 0.53 seconds
- 进行ping扫描,打印出对扫描做出响应的主机
[root@aaa ~]# nmap  -sP 10.0.0.0/24
Starting Nmap 6.40 ( http://nmap.org ) at 2022-09-30 22:15 CST
Nmap scan report for 10.0.0.1
Host is up (0.00072s latency).
MAC Address: 00:50:56:C0:00:08 (VMware)
Nmap scan report for bogon (10.0.0.254)
Host is up (-0.10s latency).
MAC Address: 00:50:56:E9:82:79 (VMware)
Nmap scan report for 10.0.0.128
Host is up.
Nmap scan report for 10.0.0.129
Host is up.
Nmap done: 256 IP addresses (4 hosts up) scanned in 2.20 seconds
- 探测主机端口号
[root@aaa ~]# nmap  -PS  22,80 10.0.0.129

Starting Nmap 6.40 ( http://nmap.org ) at 2022-09-30 22:18 CST
Failed to resolve "22,80".
Nmap scan report for 10.0.0.129
Host is up (0.0000040s latency).
Not shown: 999 closed ports
PORT   STATE SERVICE
22/tcp open  ssh

Nmap done: 1 IP address (1 host up) scanned in 2.03 seconds
或范围探测
[root@aaa ~]# nmap  10.0.0.129 -p 1-1024

Starting Nmap 6.40 ( http://nmap.org ) at 2022-09-30 22:20 CST
Nmap scan report for 10.0.0.129
Host is up (0.0000030s latency).
Not shown: 1023 closed ports
PORT   STATE SERVICE
22/tcp open  ssh

Nmap done: 1 IP address (1 host up) scanned in 1.70 seconds
- 端口扫描攻击一般只扫描固定端口,更改关键业务端口号后,安全性提升,如果对单台服务全面扫,会浪费时间
其他命令
- nc 文件传输、端口检查工具
- htop 系统进程相关信息查看工具
- sysstat 含sar iostat等重要系统性能查看工具
- nethogs 显示进程的网络流量


 2万+
2万+


 被折叠的 条评论
为什么被折叠?
被折叠的 条评论
为什么被折叠?
 到【灌水乐园】发言


