


 本文介绍了Python中Matplotlib库用于创建图例的多种方法,包括直接添加图例、自定义图例内容以及创建复杂图例。通过实例展示了如何调整图例的位置、样式、颜色和大小,以及如何将额外元素添加到图例中,帮助读者掌握高级的图表定制技巧。
1 只是简单的添加图例,直接加就好了
fig, ax = plt.subplots(2,4, figsize=(14, 8))
    ax[row, col].plot(x[0:33], y[0:33], color = "k", label = "Historical") #自己画,要有label
    ax[row,col].axvline(2050, color='k', linestyle="-.", lw = 1) #这里没有label,就不会在图例显示


# 设置图例
font={"size":35}
ax[row, col].legend(bbox_to_anchor=(-2.1, 5.2), #图例框中心点位置
             loc=6, #相对于图例框中心点,图例框的位置
             handletextpad = 0, #色块与对应名称之间的空隙
             handleheight = 1, #每个色块的宽度
             labelspacing = 0.2,  #个条目之间的距离
             frameon  = False, #石头绘制图例边框
             ncol = 3,
             columnspacing = 2,
            prop=font,
            markerscale =3, #设置marker的大小
             )
2 如果想额外的添加点儿东西到图例里面可以这样
fig, ax = plt.subplots(2,4, figsize=(14, 8))
    ax[row, col].plot(x[0:33], y[0:33], color = "k", label = "Historical") #自己画,要有label
    ax[row,col].axvline(2050, color='k', linestyle="-.", lw = 1) #这里没有label,就不会在图例显示


import matplotlib.patches as mpatches

handles, labels = ax.get_legend_handles_labels()             #已经换好了一个ax
patch = mpatches.Patch(color='red', label='The red data')   #随便画一个别的色块之类的
handles.append(patch)                                        #把色块加入到handles中
plt.legend(handles=handles, loc='upper center')              #第一步的图例设置就好了
3 也可以自己做一个图例 “handles=”是所有要加入图例里去的内容
import pandas as pd
import os
import matplotlib.pyplot as plt
import matplotlib
import matplotlib.patches as mpatches
import matplotlib.lines as mline
import matplotlib.lines as mlines
pd.set_option('display.max_columns', None)
matplotlib.rc("font",family='Times New Roman')
plt.rcParams.update({'font.size': 28})
# note 准备画图用的表格
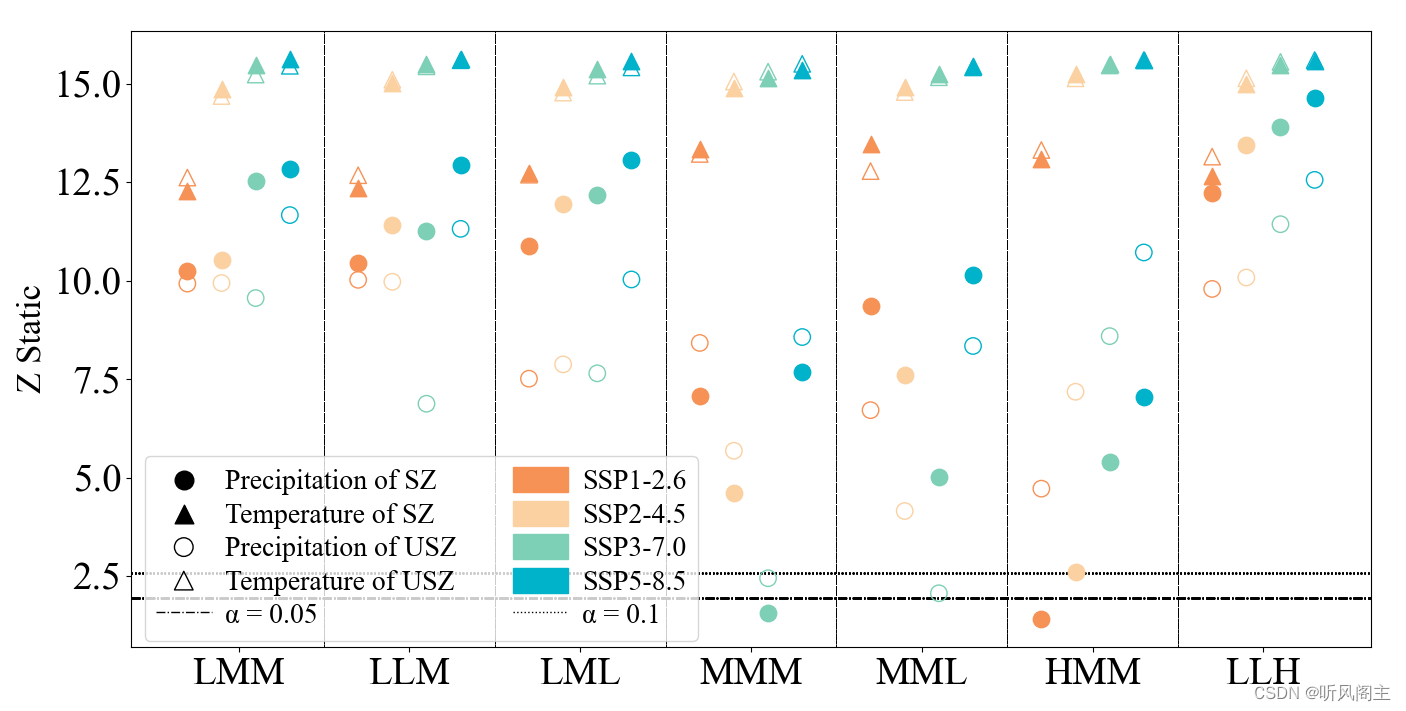
zone_or_name = ["S0", "S1", "S2", "S3", "S4", "S5", "S6"]
zone_new_name = ["LMM", "LLM", "LML","MMM","MML","HMM","LLH"]
zone_new_name_dic = {}
for i,j in zip(zone_or_name, range(0, len(zone_or_name))):
zone_new_name_dic[i] = zone_new_name[int(j)]
print(zone_new_name_dic)
df_final = pd.DataFrame()
df_final.index = zone_or_name
df_final["zone"] = df_final.index
folder = os.path.join("I:\IPCC6\Analysis2\\1")
file_list = [x for x in os.listdir(folder) if x.endswith("MK.xlsx")]
for file_name in file_list:
file_path = os.path.join(folder, file_name)
df = pd.read_excel(file_path, index_col = None)
for col in df.columns[1:]:
df = df.rename(columns = {col: file_name.split("_")[0] + "_" + file_name.split("_")[1] + "_" + col})
df_final = df_final.merge(df, on='zone', how='right')
list = []
for zone in df_final["zone"]:
list.append(zone_new_name_dic[zone])
del df_final["zone"]
df_final.insert(0, "zone", list)
df_final["num"] = [x for x in range(0,7)]
print(df_final)
# note 画图 #################
fig, ax = plt.subplots(1,1, figsize=(16, 8))
x_126 = []
for i in range(7):
i = -0.3+i
x_126.append(i)
print(x_126)
x_245 = [x + 0.2 for x in x_126]
x_370 = [x + 0.4 for x in x_126]
x_585 = [x + 0.6 for x in x_126]
x_label = [x + 0.3 for x in x_126]
print(x_label)
color_dic = {"ssp126":"#f79256", "ssp245":"#fbd1a2", "ssp370":"#7dcfb6", "ssp585":"#00b2ca"}
zone_list = ["SZ_pr", "SZ_tas", "USZ_pr", "USZ_tas"]
marker_list = ["o","^","o","^"]
marker_dic = {}
for zone, marker in zip(zone_list, marker_list):
marker_dic[zone] = marker
marker_size = 140
for col in df_final.columns[1:-1]:
print(col)
maker_name = col.split("_")[0] + "_" + col.split("_")[1]
color_name = col.split("_")[2]
if color_name == "ssp126":
x = df_final["num"] - 0.3
elif color_name == "ssp245":
x = df_final["num"] - 0.1
elif color_name == "ssp370":
x = df_final["num"] + 0.1
elif color_name == "ssp585":
x = df_final["num"] + 0.3
y = df_final[col]
if maker_name == "SZ_pr" or maker_name == "SZ_tas":
ax.scatter(x,y, marker = marker_dic[maker_name], s = marker_size, color = color_dic[color_name], label = col)
elif maker_name == "USZ_pr" or maker_name == "USZ_tas":
ax.scatter(x,y, marker = marker_dic[maker_name], s = marker_size, facecolor = "none", edgecolors=color_dic[color_name], label = col)
for i in [0.5, 1.5, 2.5,3.5,4.5,5.5]:
ax.axvline(i,color='k', linestyle='--',lw = 0.5)
ax.set_xticks(range(7), ["LMM", "LLM", "LML","MMM","MML","HMM","LLH"])
ax.axhline(1.96, color = "k", linestyle = "-.", lw = 1, label = "α = 0.05", zorder = 0)
ax.axhline(2.58, color = "k", linestyle = ":", lw = 1, label = "α = 0.1", zorder = 0)
marker_size = 20
handles = []
handles = handles +[
ax.scatter([],[], marker = "o", s = marker_size, facecolor = "k", edgecolors= "k", label = "Precipitation of SZ"),
ax.scatter([],[], marker = "^", s = marker_size, facecolor = "k", edgecolors= "k", label = "Temperature of SZ"),
ax.scatter([],[], marker = "o", s = marker_size, facecolor = "none", edgecolors= "k", label = "Precipitation of USZ"),
ax.scatter([],[], marker = "^", s = marker_size, facecolor = "none", edgecolors= "k", label = "Temperature of USZ"),
mline.Line2D([],[], color = "k", linestyle = "-.", lw = 1, label = "α = 0.05"),
mpatches.Patch(color="#f79256", label='SSP1-2.6'),
mpatches.Patch(color="#fbd1a2", label='SSP2-4.5'),
mpatches.Patch(color="#7dcfb6", label='SSP3-7.0'),
mpatches.Patch(color="#00b2ca", label='SSP5-8.5'),
mline.Line2D([],[], color = "k", linestyle = ":", lw = 1, label = "α = 0.1")
]
font={"size":20}
plt.legend(handles = handles,
bbox_to_anchor=(0, 0.16), #图例框中心点位置
loc=6, #相对于图例框中心点,图例框的位置
handletextpad = 0.5, #色块与对应名称之间的空隙
handleheight = 1, #每个色块的宽度
labelspacing = 0.2, #个条目之间的距离
frameon = True, #石头绘制图例边框
ncol = 2,
columnspacing = 2,
prop=font,
markerscale =3, #设置marker的大小
)
ax.set_ylabel("Z Static", fontsize = 25)
plt.savefig(os.path.join("I:\IPCC6\Analysis2\\1", "MK"+".jpg"),dpi=400,bbox_inches = 'tight')
plt.show()


 被折叠的 条评论
为什么被折叠?
被折叠的 条评论
为什么被折叠?
 到【灌水乐园】发言


