from matplotlib import pyplot as plt
import matplotlib
font ={'family':'MicroSoft YaHei'}#win可以显示中文
matplotlib.rc("font",**font)
a=["画皮","功夫熊猫","西游记","红楼梦","速度与激情8","战狼2","军舰岛"]
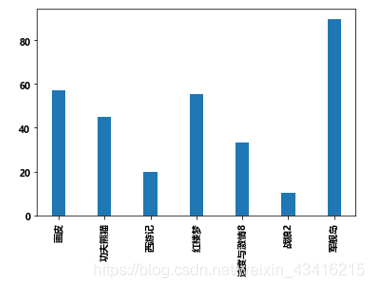
b=[57.01,45,19.89,55.21,33.21,10.08,89.80]#绘制竖着的条形图
plt.bar(range(len(a)),b,width=0.3)#width为条形图的宽度#设置x轴
plt.xticks(range(len(a)),a,rotation=90)
plt.show()
画竖着的条形图
from matplotlib import pyplot as plt
import matplotlib
font ={'family':'MicroSoft YaHei'}#win可以显示中文
matplotlib.rc("font",**font)
a=["画皮","功夫熊猫","西游记","红楼梦","速度与激情8","战狼2","军舰岛"]
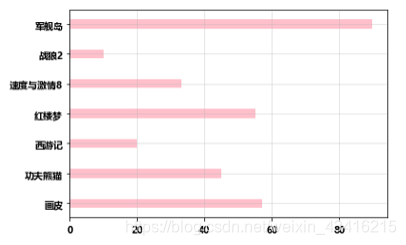
b=[57.01,45,19.89,55.21,33.21,10.08,89.80]#绘制横着的条形图
plt.barh(range(len(a)),b,height=0.3,color="pink")#height为条形图的宽度#设置y轴
plt.yticks(range(len(a)),a)#设置网格
plt.grid(alpha=0.4)
plt.show()
画多次条形图
from matplotlib import pyplot as plt
import matplotlib
font ={'family':'MicroSoft YaHei'}#win可以显示中文
matplotlib.rc("font",**font)
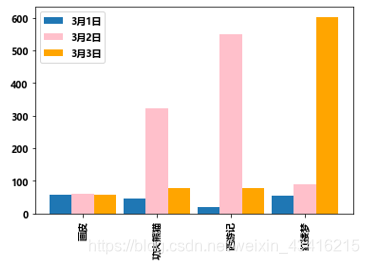
a=["画皮","功夫熊猫","西游记","红楼梦"]
b=[57,45,19,55]
b2=[60,323,549,89]
b3=[59,79,78,603]#绘制竖着的条形图
bar_width =0.3#条形图右移,使之不重叠
x_b=list(range(len(a)))
x_b2=[i+bar_width for i in x_b]
x_b3=[i+bar_width*2for i in x_b]
plt.bar(x_b,b,width=bar_width,label="3月1日")#width为条形图的宽度
plt.bar(x_b2,b2,width=bar_width,label="3月2日",color="pink")
plt.bar(x_b3,b3,width=bar_width,label="3月3日",color="orange")#设置图例
plt.legend()#设置x轴
plt.xticks(x_b2,a,rotation=90)#x轴对齐b2的数据
plt.show()


 397
397


 被折叠的 条评论
为什么被折叠?
被折叠的 条评论
为什么被折叠?
 到【灌水乐园】发言


