


发表到 爱可生开源社区 技术分享 | 企业版监控工具 MEM 初探
MySQL在企业版里的有个工具MySQL Enterprise Monitor,可以用于监控MySQL实例和主机性能。现实验如下:
安装
下载
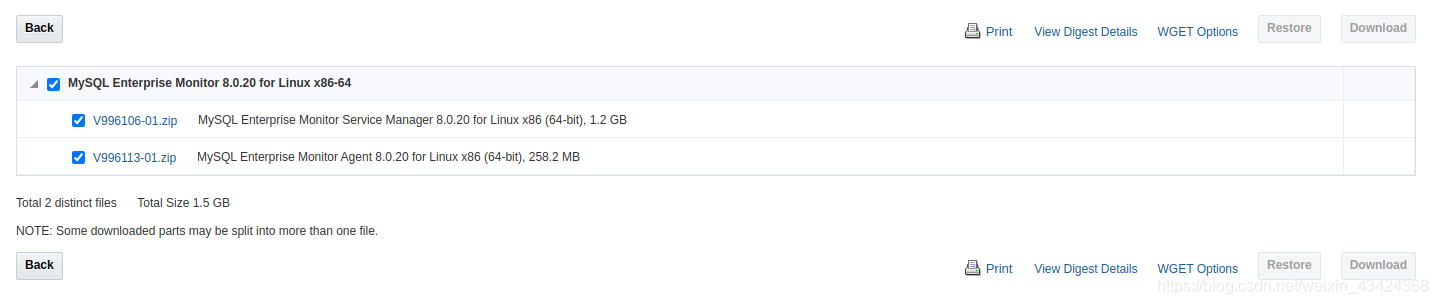
到https://edelivery.oracle.com/ 网站下软件:
安装服务端
unzip mysql_monitor.zip
./mysqlmonitor-8.0.20.1237-linux-x86_64-installer.bin scutech@scutech:~/install$ ll
total 2819608
drwxrwxr-x 2 scutech scutech 4096 Jun 1 23:45 ./
drwxr-xr-x 30 scutech scutech 4096 Jun 1 23:43 ../
-rw-r-xr-- 1 scutech scutech 975 Apr 23 05:50 README_en.txt*
-rw-r-xr-- 1 scutech scutech 975 Apr 23 05:51 READ_ME_ja.txt*
-rw-r--r-- 1 scutech scutech 6370627 Apr 22 08:14 monitor.a4.pdf
-rw-r--r-- 1 scutech scutech 6377434 Apr 22 08:13 monitor.pdf
-rw-r--r-- 1 scutech scutech 5277767 Apr 22 08:12 mysql-monitor-html.tar.gz
-rw-r--r-- 1 scutech scutech 5302202 Apr 22 08:12 mysql-monitor-html.zip
-rw-r--r-- 1 scutech scutech 1297382933 Jun 1 23:44 mysql_monitor.zip
-rw-r--r-- 1 scutech scutech 270694162 Jun 1 23:44 mysql_monitor_agent.zip
-rwxrwxr-x 1 scutech scutech 647902090 Apr 22 12:26 mysqlmonitor-8.0.20.1237-linux-x86_64-installer.bin*
-rwxrwxr-x 1 scutech scutech 647923832 Apr 22 12:35 mysqlmonitor-8.0.20.1237-linux-x86_64-update-installer.bin*
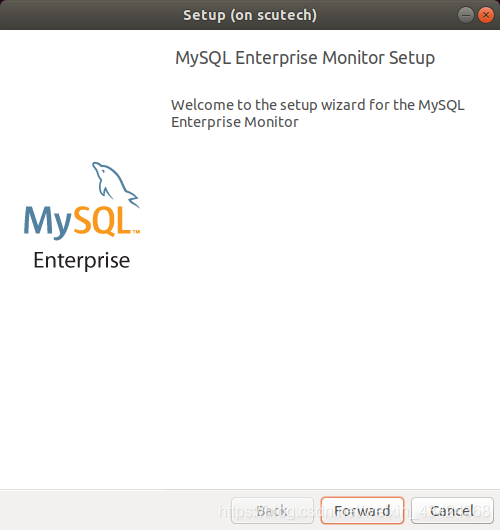
./mysqlmonitor-8.0.20.1237-linux-x86_64-installer.bin
运行上面的命令后出现下面的画面:
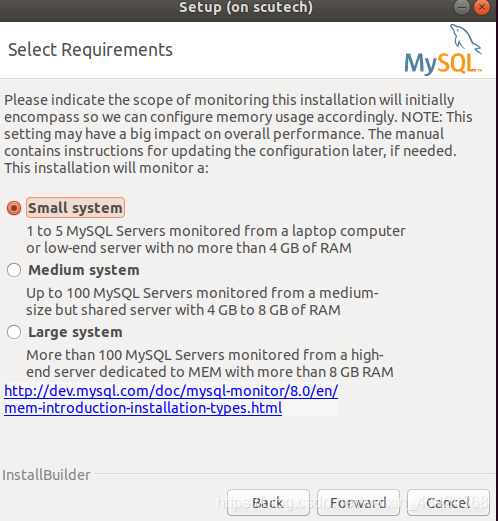
选择小型模式
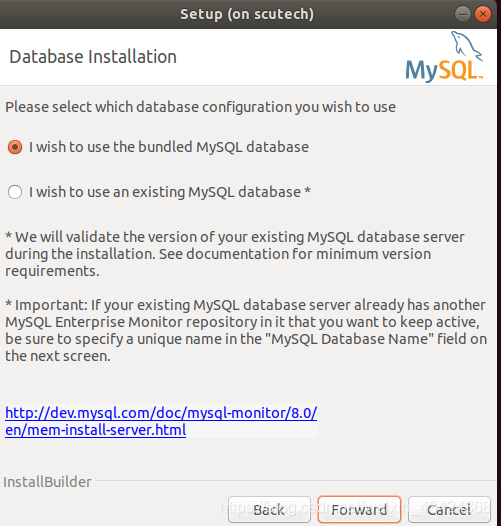
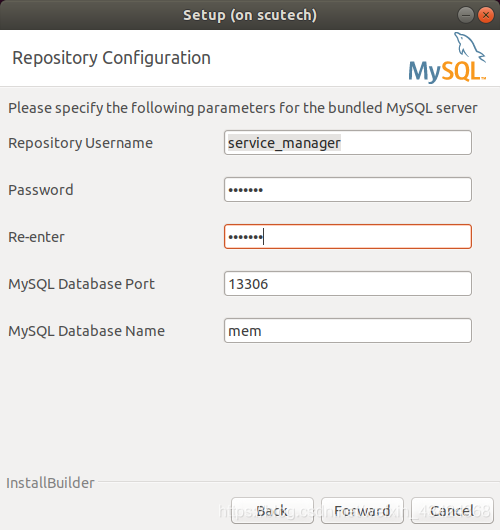
使用安装软件自带的MySQL数据库作为repository数据库
这个用户(service_manager)和密码等相关信息要记录下来。
提示下面的信息,其中提到的root用户是OS的用户,不是mysql的用户:
You have not installed the MySQL Enterprise Monitor as the root user. Therefore it could not be configured to auto-start on reboot. See the Installation section of the MySQL Enterprise Monitor documentation for instructions on how to do this manually.
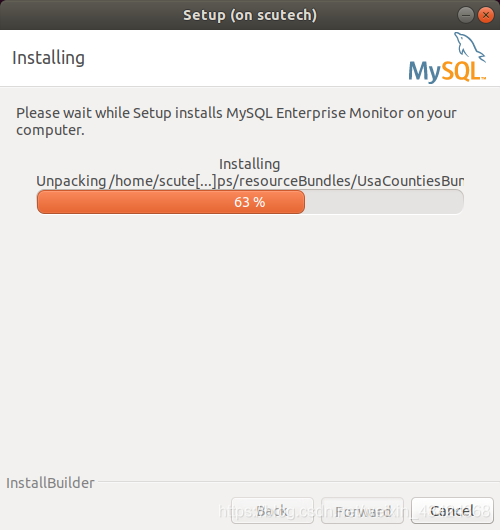
开始安装:
安装完成提示:
Setup has completed installing the MySQL Enterprise Monitor files on your computer
Uninstalling the MySQL Enterprise Monitor files can be done by invoking:
/home/scutech/mysql/enterprise/monitor/uninstall
To complete the installation, launch the MySQL Enterprise Monitor UI and complete the initial setup. Refer to the readme file for additional information and a list of known issues.
Please press next to launch the Monitor UI.
管理脚本
usage: ./mysqlmonitorctl.sh help
       ./mysqlmonitorctl.sh (start|stop|status|restart)
       ./mysqlmonitorctl.sh (start|stop|status|restart) mysql
       ./mysqlmonitorctl.sh (start|stop|status|restart) tomcat

help       - this screen
start      - start the service(s)
stop       - stop  the service(s)
restart    - restart or start the service(s)
status     - report the status of the service(s)
使用下面的链接可以访问MySQL Enterprise Monitor https://192.168.???.???:18443
用户 sc_manager
安装客户端
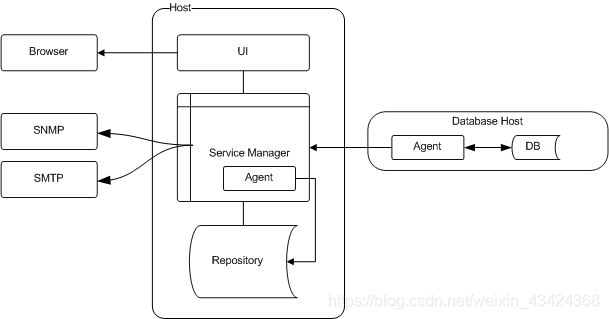
客户端分两种,第一种是在客户端安装被监控的机器上(The architecture of a typical MySQL Enterprise Monitor installation),架构见下图:
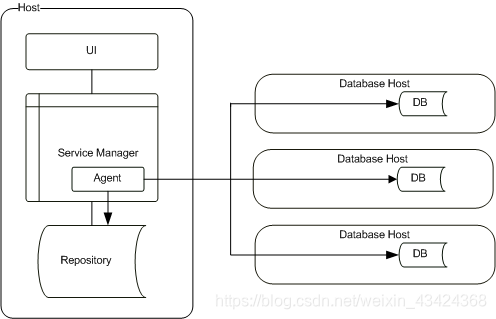
第二种是不在被监控的机器上安装任何软件(Agentless Architecture),架构见下图:
这两者的对比:
- 从架构上看二者区别非常明显,一个有agent,另一个没有agent;
- 没有agent的方式用起来方便,配置IP地址,用户,密码等连接方式后直接就可以用了;
- 没有agent的方式不能监控主机上非MySQL的信息,而有agent的方式可以;
- 从性能的角度考虑,推荐使用有agent的方式。
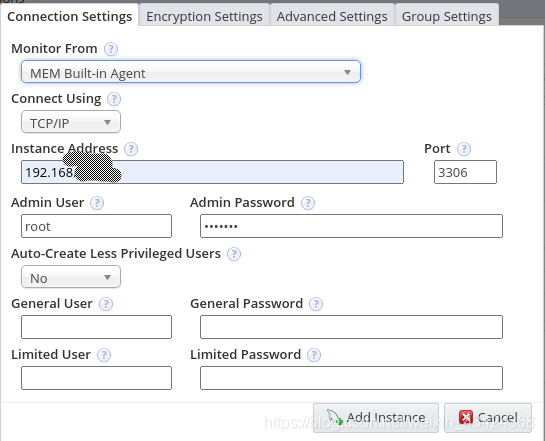
下面是安装一个没有agent的客户端的例子:
使用
概览(overview)
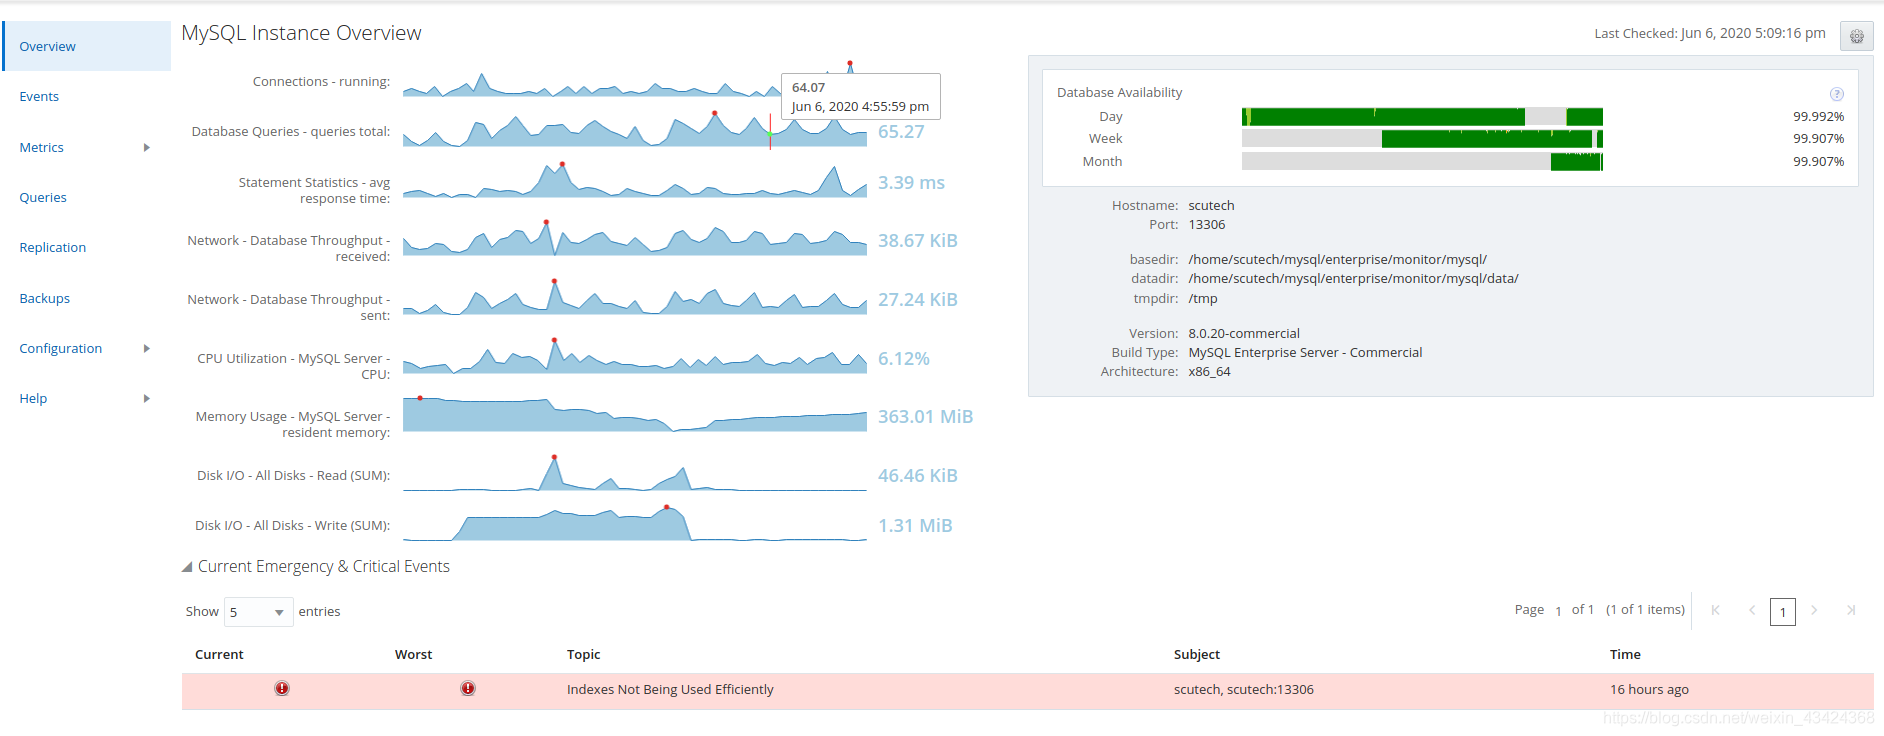
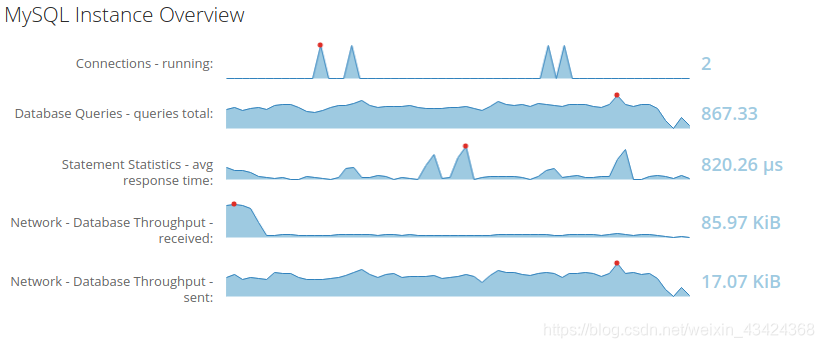
从overview中可以看到被监控对象的大概情况,设置是点击右上角的齿轮。这是有agent的监控概览,包括了主机的信息,例如磁盘读写,内存使用等。没有agent的监控只有数据库的信息,如下图:
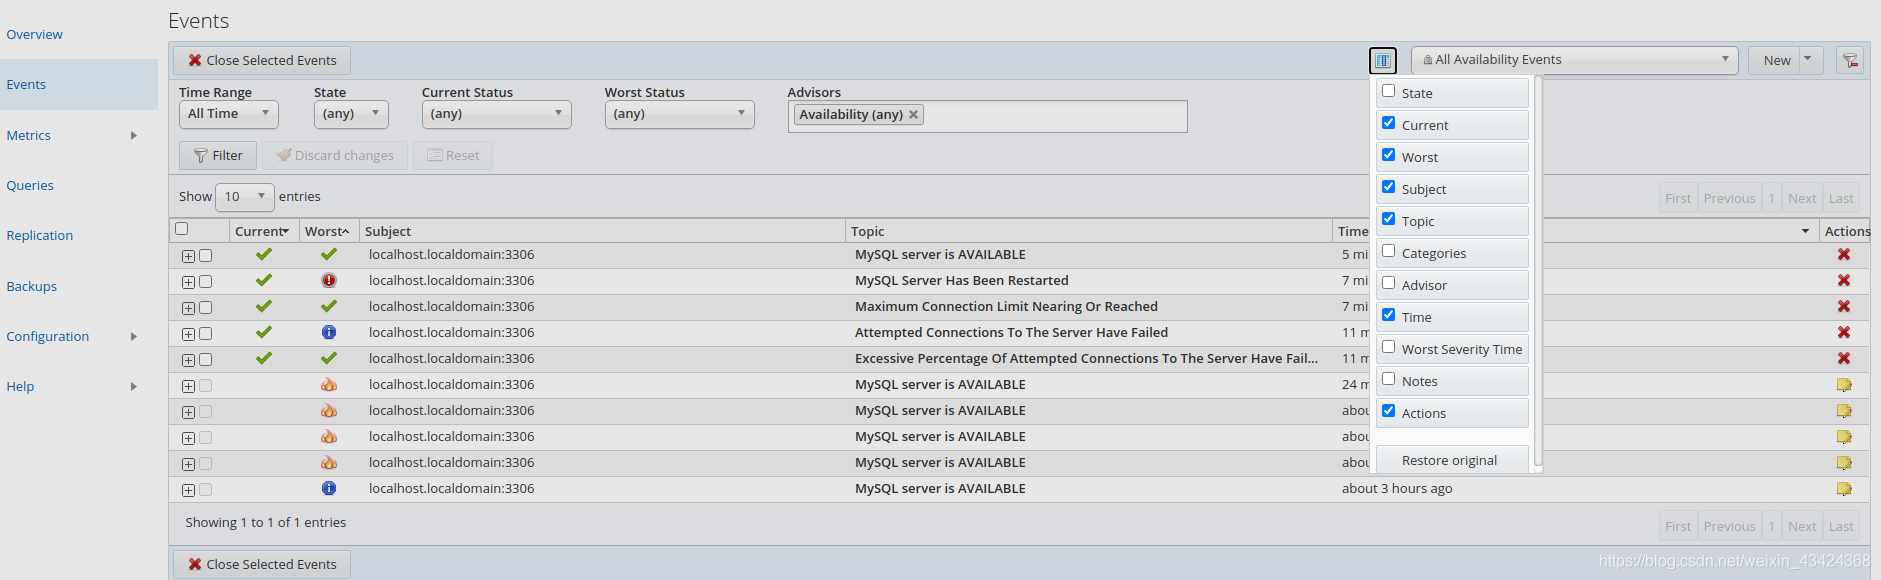
事件(event)
超过阀值的事件会在这里列出,阀值的配置在configuration->advisor里面,可以关闭的事件点击最右边action下面的叉叉符合即可关闭。
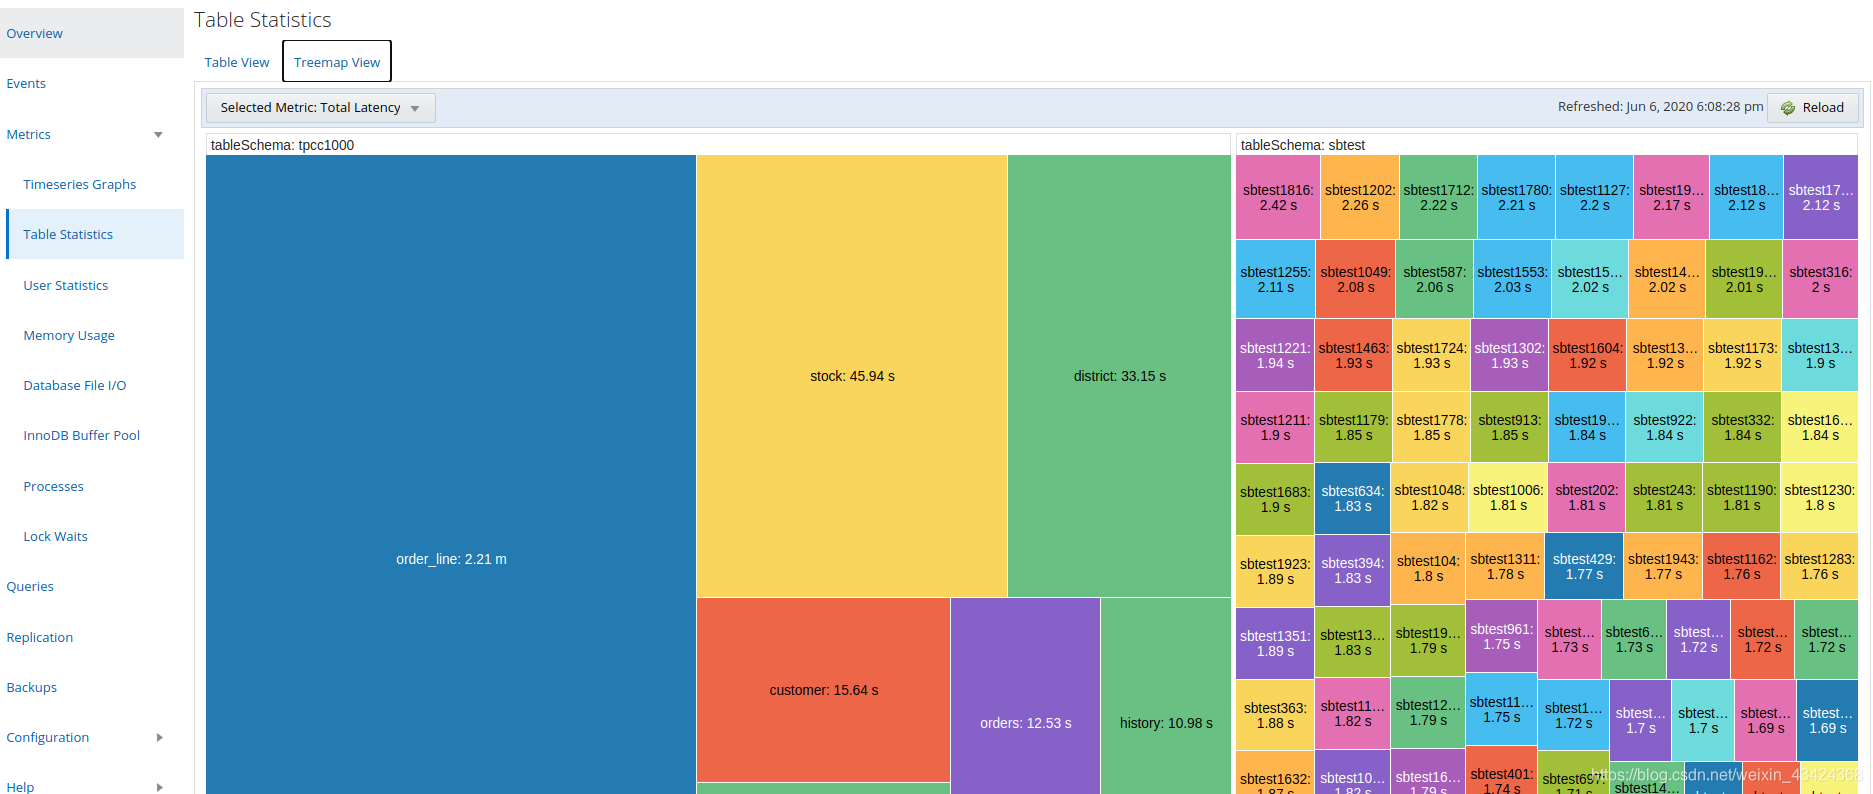
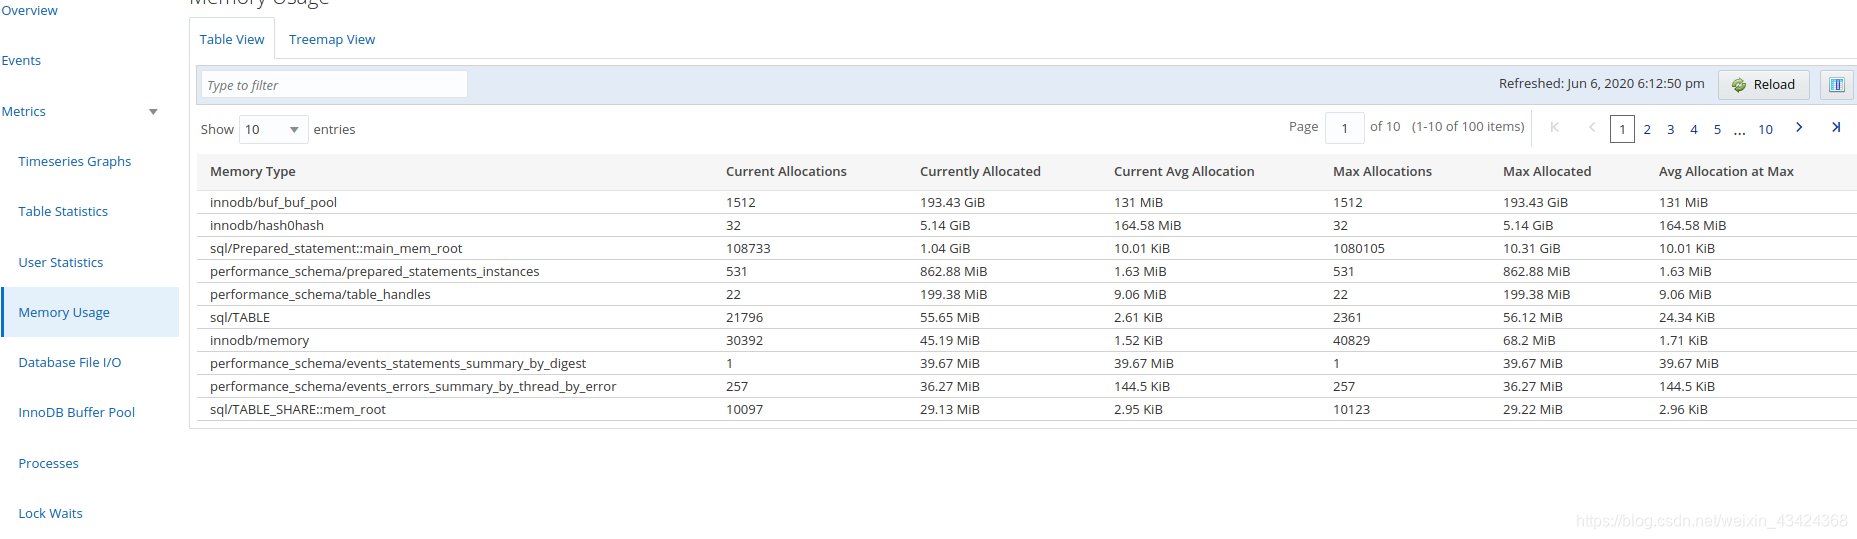
指标(metrics)
这里有很多衡量被监控对象的指标,这里列举比较有用的几例:
查询分析(Query Analyzer)
查询分析的数据来自 Performance Schema Statement Digests 特性Performance Schema Statement Digests and Sampling,早于MySQL 5.6.14的版本不支持这个特性。
被分析的语句的长度不能超过下面的参数,否则截断
$ mysqladmin variables|grep max_digest_leng
| max_digest_length                                        | 1024                                                                                                                                                                                                                                                                                                                                                                                                                                                                 |
| performance_schema_max_digest_length                     | 1024                                                                                                                                                                                                                                                                                                                                                                                                                                                                 |
注意:第一个参数max_digest_length是session级别的,而第二个performance_schema_max_digest_length是语句级别的,只对performance_schema起作用。
MySQL Enterprise Monitor Agent每分钟收集一次表performance_schema.events_statements_summary_by_digest,这个表由下面的参数statements_digest 决定是否激活,默认是激活的:
mysql> SELECT * FROM performance_schema.setup_consumers WHERE name = 'statements_digest';
+-------------------+---------+
| NAME              | ENABLED |
+-------------------+---------+
| statements_digest | YES     |
+-------------------+---------+
1 row in set (0.00 sec)
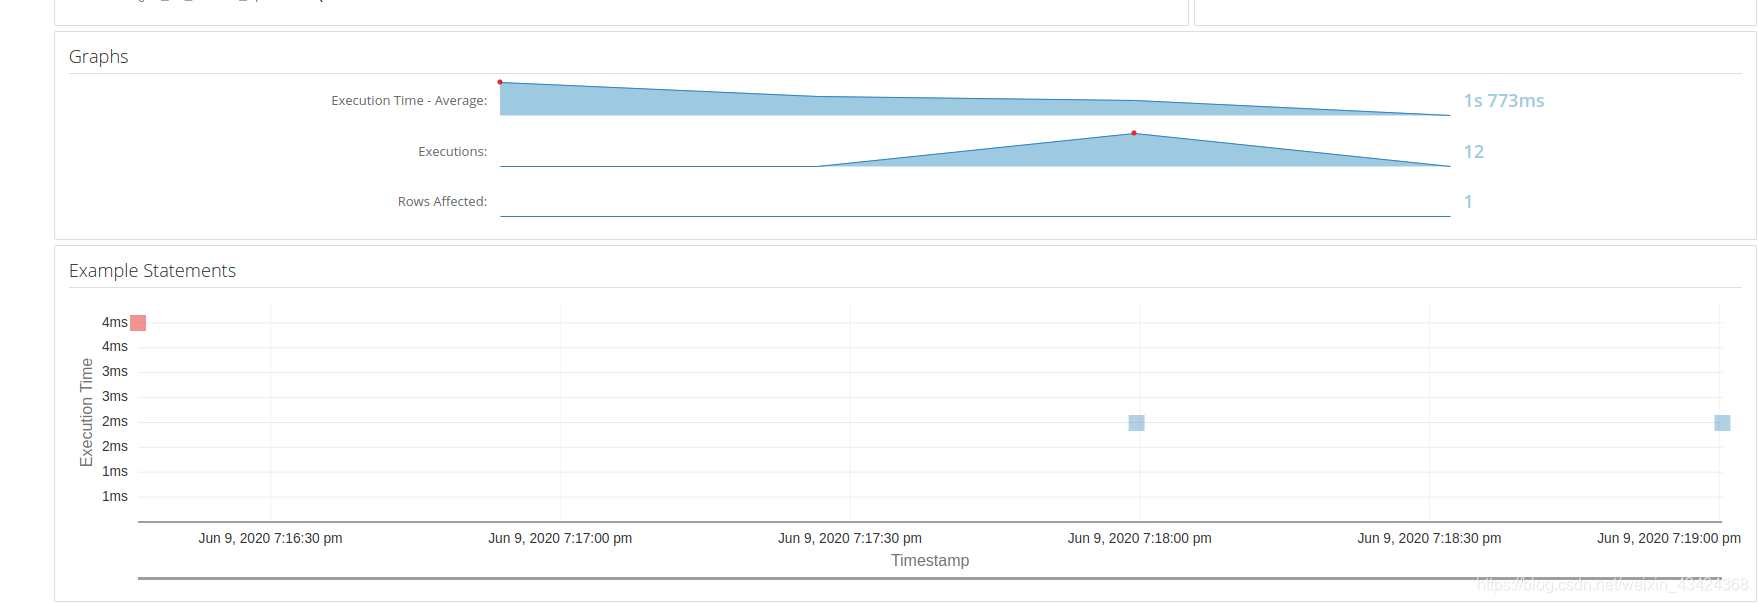
监控的样图如下: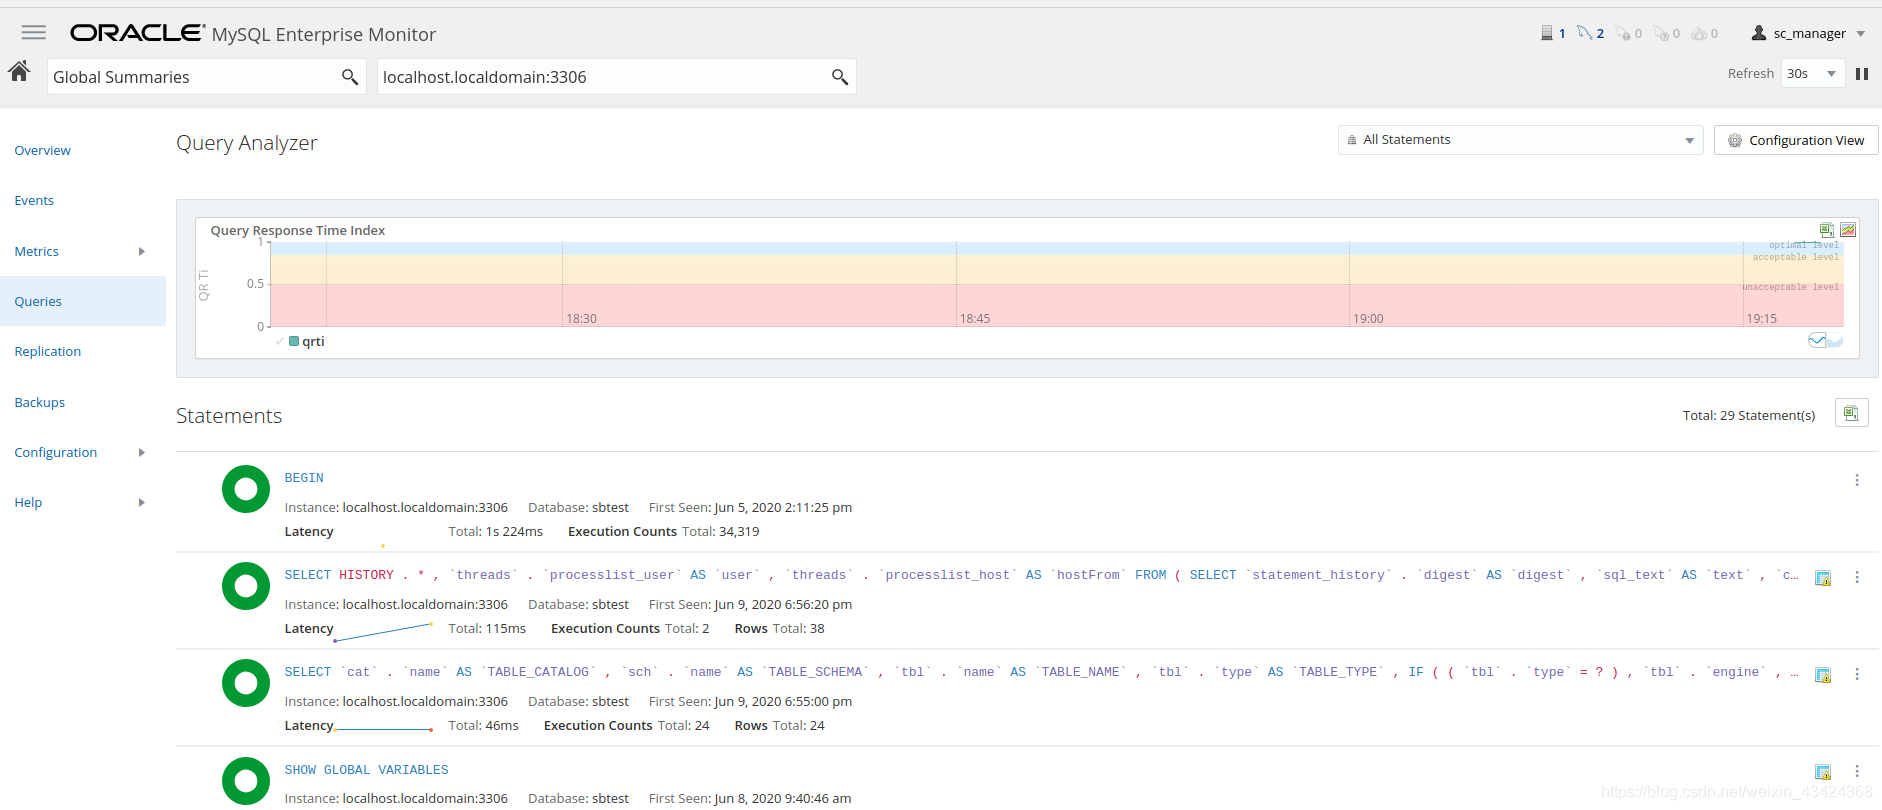
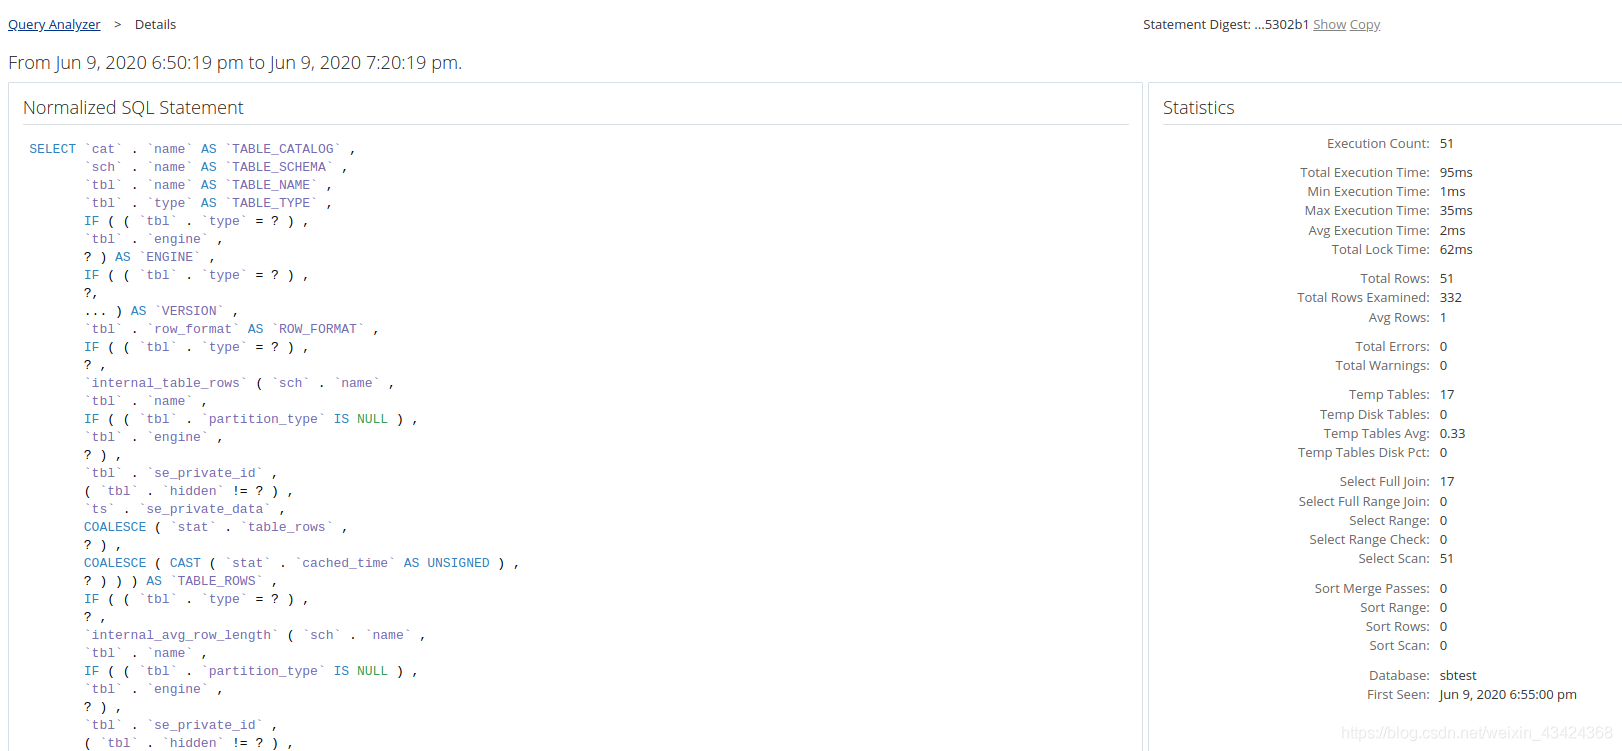
在每个SQL statement后面有细节选项,点击进入可看这个SQL statement的细节:
当看这个SQL statement的例子的时候,可能因为配置的原因没有显示,这时会有下面的提示:
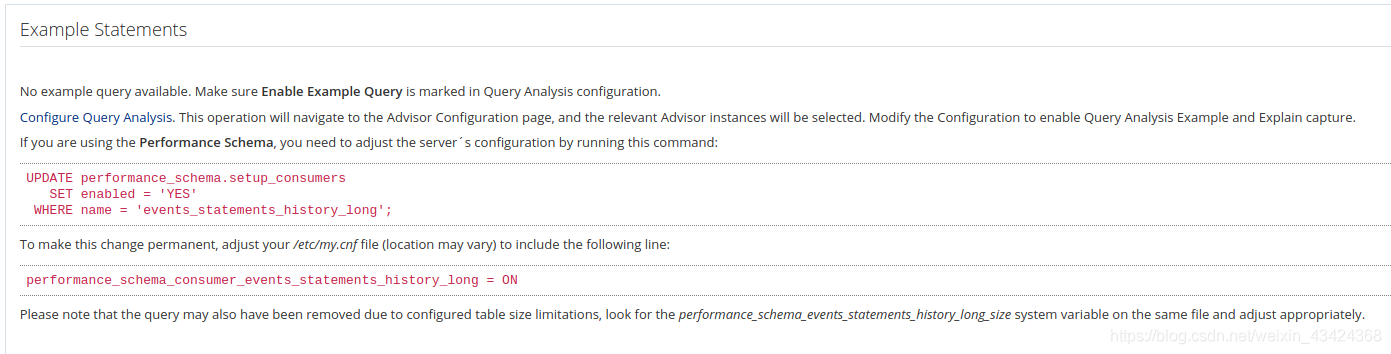
设置正确后会出现下面的画面:


 1031
1031

 被折叠的 条评论
为什么被折叠?
被折叠的 条评论
为什么被折叠?
 到【灌水乐园】发言


