


openlayers地图使用—跟随地图比例尺动态标绘大小的一种方式
预期:随着地图比例尺放大缩小,地图上的标绘随着变化尺寸
思路:通过VectorImage和动态修改Feature尺寸实现Feature跟随地图比例尺尺寸变化
优点:结合第1和第2种方式的优点,效果较好,且有过渡效果,数量越多,过渡效果越好(标绘的尺寸突变越不明显)地图响应迅速,地图操作不卡顿,图片缩放过渡自然
页面
  <script src="https://cdn.bootcdn.net/ajax/libs/openlayers/8.1.0/dist/ol.min.js"></script>
  <link href="https://cdn.bootcdn.net/ajax/libs/openlayers/8.1.0/ol.min.css" rel="stylesheet">
  <style>
    .olMap {
      width: 100%;
      height: 500px;
    }
  </style>
</head>

<div id="map" class="olMap"></div>
js代码
var map = null; // 地图
var vectorSource = null;//图源
var feas = [];// features集合
// 初始化地图
function initMap() {
// 矢量图层
vectorSource = new ol.source.Vector();
// 创建矢量图层 绘制标注
const vLayer = new ol.layer.Vector({
source: vectorSource
})
// 创建一个新的 VectorImageLayer 实例
const vectorLayerx = new ol.layer.VectorImage({
source: vectorSource,
zIndex: 99,
style: function (feature) {
// 定义样式函数,根据需要自定义样式
const style = new Style({
image: new ol.style.Icon({
src: '../assets/bg02.jpg', // 替换为你自己的图标URL
size: [160, 160] // 图标大小
})
});
return style;
}
});
// 高德地图
var gaodeMapLayer = new ol.layer.Tile({
title: "高德地图",
source: new ol.source.XYZ({
url: 'http://wprd0{1-4}.is.autonavi.com/appmaptile?lang=zh_cn&size=1&style=7&x={x}&y={y}&z={z}',
wrapX: false
})
});
//地图容器
map = new ol.Map({
target: 'map',
layers: [
gaodeMapLayer,
vectorLayerx
],
view: new ol.View({
center: ol.proj.transform([103.23, 35.33], 'EPSG:4326', 'EPSG:3857'), //地图初始中心点
zoom: 12,
minZoom: 1,
maxZoom: 29
}),
})
}
initMap()
/**
* @description: 绘制一些图片
* 特点:修改了图层类型,相比较与普通图层 更丝滑
* @param {*} num
* @return {*}
* @author: ldl
*/
function drawSome(num) {
vectorSource.clear()
feas = []
// 添加若干图片
for (let i = 0; i < num; i++) {
// 创建一个活动图标需要的Feature,并设置随机位置
const r1 = Math.random();
const r2 = Math.random();
let rand1 = r1 / 100 + i / 1000 + i / 1000;
let rand2 = r2 / 100 + i / 1000 + i / 1000;
rand1 = r1 > 0.45 ? rand1 : -rand1;
rand2 = r2 > 0.45 ? rand2 : -rand2;
const feature = new ol.Feature({
geometry: new ol.geom.Point(ol.proj.transform([103.23 + rand1, 35.33 + rand2], 'EPSG:4326', 'EPSG:3857'))
})
feature.setId(9999 + i);
// 设置Feature的样式,使用小旗帜图标
feature.setStyle(
new ol.style.Style({
image: new ol.style.Icon({
src: "./bg02.jpg",
anchor: [0.5, 1],
scale: getScaleImgae(3000)
})
})
)
feas.push(feature)
vectorSource.addFeature(feature)
}
}
// 修改标绘的尺寸
function reDrawFeatures() {
// 添加若干图片
for (let i = 0; i < feas.length; i++) {
const feature = feas[i]
// 设置缩放等级
feature.getStyle().getImage().setScale(getScaleImgae(3000))
}
}
// 计算不同比例尺下 实际距离在屏幕上的宽度px
function getLengthPixel(length) {
return length / map.getView().getResolution()
}
// 计算不同比例尺下,图片在屏幕上应该缩放的大小
function getScaleImgae(length) {
// 图片源文件的实际宽度px
const info = { width: 800 }
const scale = getLengthPixel(length) / info.width
return scale
}
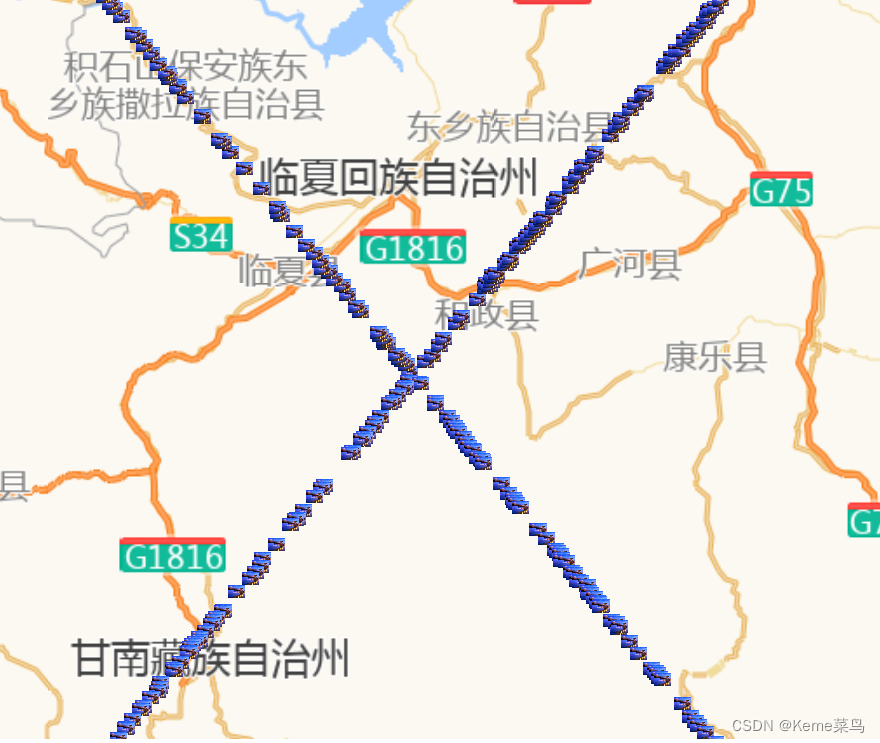
drawSome(20000)
setInterval(() => {
reDrawFeatures()
}, 300)
如上,绘制20000个标绘,标绘的缩放效果依然流畅。
总结三种实现跟随地图比例尺动态标绘大小的方式(见实现方式1和实现方式2):
1.第2种方式,非常适合标绘数量小于10000个的情形,使用ImageStatic实现,过渡自然;
2. 第3种方式,适合比较多的标绘,过渡效果较第2种方式差一丢丢,但是不会卡顿地图操作;
3. 第1种方式是直接修改Feature的样式,过渡效果相对其他方式最差。


 被折叠的 条评论
为什么被折叠?
被折叠的 条评论
为什么被折叠?
 到【灌水乐园】发言


