


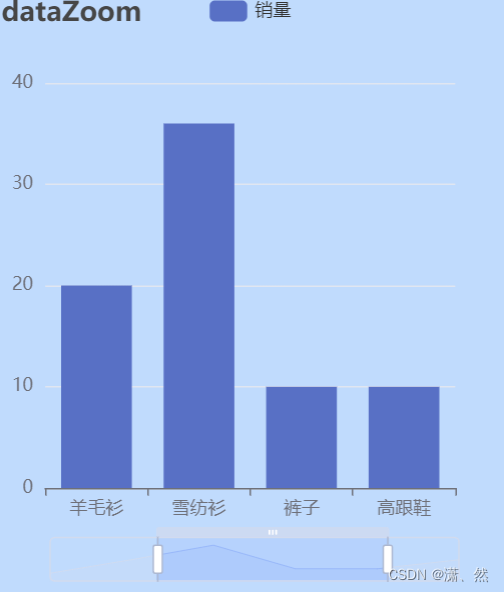
dataZoom 区域缩放
假设 X 轴数据过多,利用 dataZoom 实现滚动条展示数据
<script lang="ts" setup>
import * as echarts from 'echarts'

defineOptions({ name: 'EchartsView' })

const myChart = shallowRef()
const echartsRef = ref(null)
function initEcharts() {
  myChart.value = echarts.init(echartsRef.value)

  var option = {
    title: {
      text: 'dataZoom'
    },
    grid: {},
    dataZoom: [
    	{
    		// 有单独的滑动条
	    	type: 'slider',
	    	// 数据窗口范围的起始数值
	    	startValue: 0,
	    	// 数据窗口范围的结束数值
	    	endValue: 2,
	    	// 是否显示
	    	show: true
    	}
    ],
    tooltip: {},
    legend: {
      data: ['销量']
    },
    xAxis: {
      data: ['衬衫', '羊毛衫', '雪纺衫', '裤子', '高跟鞋', '袜子']
    },
    yAxis: {},
    series: [
      {
        name: '销量',
        type: 'bar',
        data: [5, 20, 36, 10, 10, 20]
      }
    ]
  }

  myChart.value.setOption(option)

}
onMounted(() => {
  initEcharts()
})
</script>

<template>
  <div ref="echartsRef" class="w-20vw h-400px bg-blue-200"></div>
</template>
实现定时滚动功能
const options = {
	...
    dataZoom: [
    	{
	    	type: 'inside',
	    	// 数据窗口范围的起始数值
	    	startValue: 0,
	    	// 数据窗口范围的结束数值
	    	endValue: 2
    	}
    ],
}
myChart.value.setOption(option)
使用定时器,实现滚动功能
setInterval(() => {
	// 如果dataZoom最后一个数据 == data数据的长度,那么重置
    if (option.dataZoom[0].endValue == 6) {
      option.dataZoom[0].endValue = 2
      option.dataZoom[0].startValue = 0
    } else {
      // 否则数据向后移动
      option.dataZoom[0].endValue = option.dataZoom[0].endValue + 1
      option.dataZoom[0].startValue = option.dataZoom[0].startValue + 1
    }
    myChart.value.setOption(option)
  }, 3000)
完整代码
<script lang="ts" setup>
import * as echarts from 'echarts'

defineOptions({ name: 'EchartsView' })

const myChart = shallowRef()
const echartsRef = ref(null)
function initEcharts() {
  myChart.value = echarts.init(echartsRef.value)

  var option = {
    title: {
      text: 'dataZoom'
    },
    grid: {},
    dataZoom: [{ type: 'inside', startValue: 0, endValue: 2 }],
    tooltip: {},
    legend: {
      data: ['销量']
    },
    xAxis: {
      data: ['衬衫', '羊毛衫', '雪纺衫', '裤子', '高跟鞋', '袜子']
    },
    yAxis: {},
    series: [
      {
        name: '销量',
        type: 'bar',
        data: [5, 20, 36, 10, 10, 20]
      }
    ]
  }

  myChart.value.setOption(option)

  setInterval(() => {
    if (option.dataZoom[0].endValue == 6) {
      option.dataZoom[0].endValue = 2
      option.dataZoom[0].startValue = 0
    } else {
      option.dataZoom[0].endValue = option.dataZoom[0].endValue + 1
      option.dataZoom[0].startValue = option.dataZoom[0].startValue + 1
    }
    myChart.value.setOption(option)
  }, 3000)
}
onMounted(() => {
  initEcharts()
})
</script>

<template>
  <div ref="echartsRef" class="w-20vw h-400px bg-blue-200"></div>
</template>


 1254
1254


 被折叠的 条评论
为什么被折叠?
被折叠的 条评论
为什么被折叠?
 到【灌水乐园】发言


