


使用:annotation函数
例子:
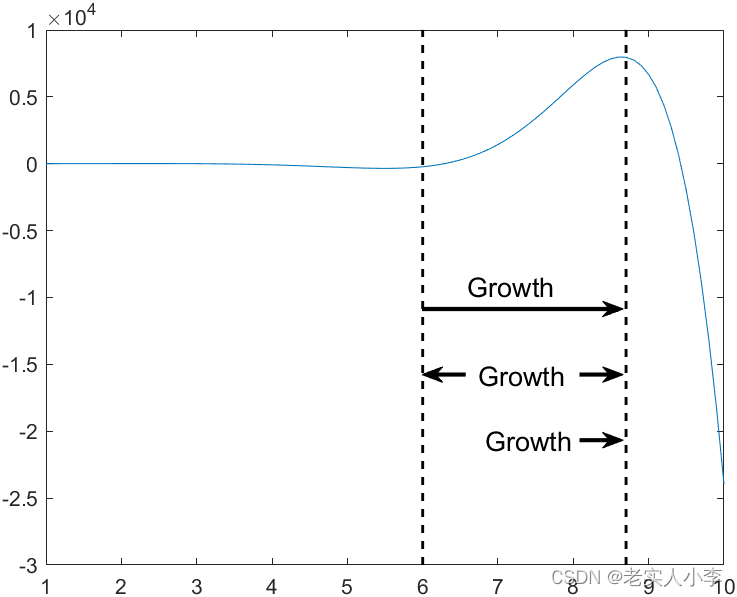
t = 1:0.1:10;   wo = 1;
x = 2*exp(t*wo).*sin(t*wo);

plot(t,x),hold on
plot([6 6],[-1e5 1e5],'--k','Linewidth',1.4)
plot([8.7 8.7],[-1e5 1e5],'--k','Linewidth',1.4)
ylim([-0.3e5 1e4])

% One arrow from left to right with text on left side
x = [0.74 0.79];    % adjust length and location of arrow
y = [0.3 0.3];      % adjust hieght and width of arrow
annotation('textarrow',x,y,'String',' Growth ','FontSize',13,'Linewidth',2)

% Arrow with two head at both end and text between
y = [0.4 0.4];
Xadj = 1.35;      % adjust location of left arrow starting point (the sum of this with 'x' should not be negative)
annotation('textarrow',x,y,'String',' Growth  ','FontSize',13,'Linewidth',2)
annotation('textarrow',-x+Xadj,y,'String','','FontSize',14,'Linewidth',2)

% One arrow from left to right with text over it
x = [0.56 0.79];   % adjust length and location of arrow
y = [0.5 0.5];
annotation('textarrow',x,y,'FontSize',13,'Linewidth',2)
annotation('textbox',[.6 .3 .7 .27],'EdgeColor','none','String','Growth','FontSize',13,'Linewidth',2)
结果:


 1862
1862


 被折叠的 条评论
为什么被折叠?
被折叠的 条评论
为什么被折叠?
 到【灌水乐园】发言


