


数据可视化
Echarts的本地使用
(1)首先在官网上下载 echart.js
(2)将本地echart.js的路径引入
(3)构建容器
(4)绘制图表
Djando
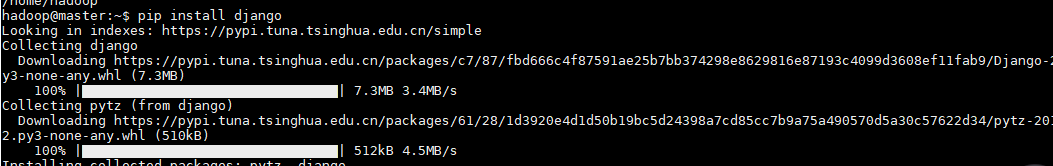
- 安装Django
pip install django
- 创建一个项目
django-admin.py startproject ui
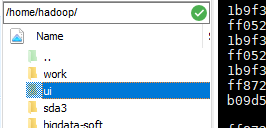
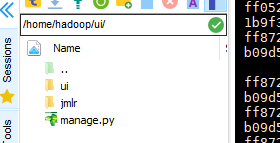
- 创建一个应用
hadoop@master:~/ui$ ls
manage.py ui
hadoop@master:~/ui$ python manage.py startapp jmlr
- 运行Django
python manage.py runserver 0.0.0.0:8000
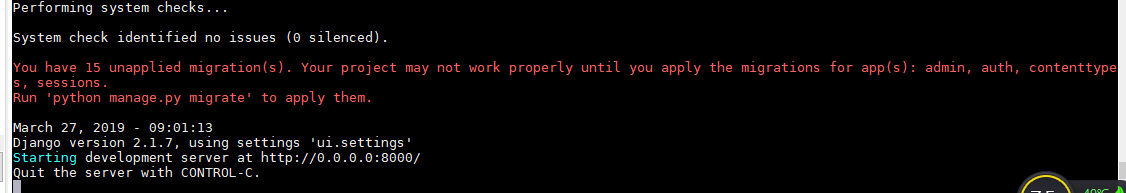
出错 - 修改ui/settings.py 允许外部地址访问
增加如下内容,让所有地址均可访问
ALLOWED_HOSTS = [‘*’,] - 将ui项目下载到本地
pycharm中新建项目 - 进入Pycharm远程开发环境

修改如上配置 - 还会出错

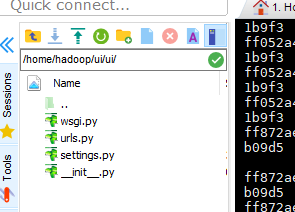
- 编辑ui/urls.py 文件增加路由
from django.contrib import admin
from django.urls import path
from django.conf.urls import url
from jmlr import views
urlpatterns = [
 url(r'^$', views.hello),
 path('admin/', admin.site.urls),
]
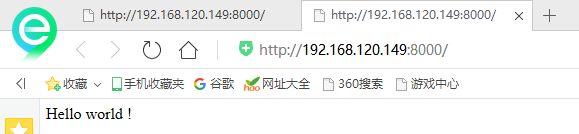
- 编辑jmlr/views.py创建响应函数
from django.shortcuts import render
from django.http import HttpResponse
def hello(request):
 return HttpResponse("Hello world ! ")
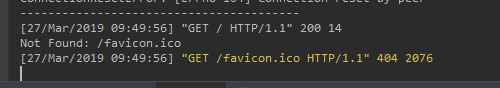
- 运行服务器,打开远程地址
- 配置echart
安装应用echart
将echarts.min.js放入 jmlr/static/目录中 当做静态文件处理。
检查ui/settings.py文件中jmlr是否在INSTALLED_APPS列表中 - 创建响应函数:
修改jmlr/views.py 添加如下函数
def lines(request):
 return render(request, 'jmlr/zhexian.html')
- 创建templates模板用于显示数据
在项目根目录创建templates/jmlr 两级目录,并创建lines.html文件
{% load static %}
<!DOCTYPE html>
<html>
<head>
 <meta charset="utf-8">
 <!-- 引入 ECharts 文件 使用 static 关键字-->
 /
 <script src="{% static 'echarts.min.js' %}"></script>
</head>
</html>
<body>
 <!-- 为 ECharts 准备一个具备大小(宽高)的 DOM -->
 <div id="main" style="width:1280px;height:850px;"></div>
</body>
</html>
- 增加模板搜索路径:修改ui/settings.py 增加新的模板目录
TEMPLATES = [
    {
        'BACKEND': 'django.template.backends.django.DjangoTemplates',
        'DIRS': [os.path.join(BASE_DIR,'templates')],
        'APP_DIRS': True,
        'OPTIONS': {
            'context_processors': [
                'django.template.context_processors.debug',
                'django.template.context_processors.request',
                'django.contrib.auth.context_processors.auth',
                'django.contrib.messages.context_processors.messages',
            ],
        },
    },
]
- 修改templates/jmlr/lines.html增加显示代码
{% load static %}
<!DOCTYPE html>
<html>
<head>
 <meta charset="utf-8">
 <!-- 引入 ECharts 文件 使用 static 关键字-->
 /
 <script src="{% static 'echarts.min.js' %}"></script>
</head>
</html>
<body>
 <!-- 为 ECharts 准备一个具备大小(宽高)的 DOM -->
 <div id="main" style="width:1280px;height:850px;"></div>
 <script type="text/javascript">
 // 基于准备好的dom,初始化echarts实例
 var myChart = echarts.init(document.getElementById('main'));
 // 指定图表的配置项和数据
 var option = {
 title: {
 text: 'Step Line'
 },
 tooltip: {
 trigger: 'axis'
 },
 legend: {
 data:['Step Start', 'Step Middle', 'Step End']
 },
 grid: {
 left: '3%',
 right: '4%',
 bottom: '3%',
 containLabel: true
 },
 toolbox: {
 feature: {
 saveAsImage: {}
 }
 },
 xAxis: {
 type: 'category',
 data: ['Mon', 'Tue', 'Wed', 'Thu', 'Fri', 'Sat', 'Sun']
 },
 yAxis: {
 type: 'value'
 },
 series: [
 {
 name:'Step Start',
 type:'line',
 step: 'start',
 data:[120, 132, 101, 134, 90, 230, 210]
 },
 {
 name:'Step Middle',
 type:'line',
 step: 'middle',
 data:[220, 282, 201, 234, 290, 430, 410]
 },
 {
 name:'Step End',
 type:'line',
 step: 'end',
 data:[450, 432, 401, 454, 590, 530, 510]
 }
 ]
};
 // 使用刚指定的配置项和数据显示图表
 myChart.setOption(option);
 </script>
</body>
- 增加url路由:修改ui/urls.py
urlpatterns = [
    path('admin/', admin.site.urls),
    url(r"^$",views.line),
]
- 编辑ui/settings.py 创建HBASE变量
HBASE_HOST='192.168.120.149'
HBASE_TABLE='jmlr'
- 编辑jmlr/views.py创建line方法
import json
from django.shortcuts import render
from django.http import HttpResponse
import happybase
from ui import settings


def line(request):
 return render(request, 'lines.html')


def line(request):
 host = settings.HBASE_HOST
 table_name = settings.HBASE_TABLE
 connection = happybase.Connection(host)
 table = connection.table(table_name)
 dict = {}
 for key, value in table.scan():
  year = int(value['paper:year'.encode('utf-8')])
  dict[year] = dict.get(year, 0) + 1
 d1 = sorted(dict.items(), key=lambda d: d[0], reverse=False)
 dic = {}
 for i in d1:
  dic[i[0]] = i[1]
 cols = list(dic.keys())
 value = list(dic.values())
 print(cols)
 print(value)
 return render(request, "lines.html", {'cols': json.dumps(cols), 'value': json.dumps(value)})


def line1(request):
 return render(request,"test1.html")
# Create your views here.
- 创建模板templates/jmlr/lines.html
{% load static %}
<html>
<head>
    <meta charset="utf-8">
</head>

<body>

<! -- 为 ECharts 准备一个具备大小(宽高)的 DOM -- >
<div >
                  <!-- 为ECharts准备一个具备大小(宽高)的Dom -->
                  <div id="main" style="height:400px"></div>
                  <script src="static/echarts/build/dist/echarts.js"></script>
                  <script type="text/javascript">
                    // 路径配置
                    var cols = {{ cols|safe }};
                    var value = {{ value|safe }};
                    require.config({
                      paths: {
                        echarts: 'static/echarts/build/dist'
                      }
                    });
                    require(
                            [
                              'echarts',
                              'echarts/chart/bar' // 使用柱状图就加载bar模块,按需加载
                            ],
                            function (ec) {
                              // 基于准备好的dom,初始化echarts图表
                              var myChart = ec.init(document.getElementById('main'));
                              var option = {
                                tooltip: {
                                  show: true
                                },
                                legend: {
                                  data:['销量']
                                },
                                xAxis : [
                                  {
                                    type : 'category',
                                    data : cols
                                  }
                                ],
                                yAxis : [
                                  {
                                    type : 'value'
                                  }
                                ],
                                series : [
                                  {
                                    "name":"销量",
                                    "type":"bar",
                                    "data":value
                                  }
                                ]
                              };

                              myChart.setOption(option);
                            }
                    );
                  </script>
                </div>
</body>
</html>
- 运行 一定注意template模板的路径应该添加正确

统计年份的只需要看后几个就可以


 3151
3151


 被折叠的 条评论
为什么被折叠?
被折叠的 条评论
为什么被折叠?
 到【灌水乐园】发言


