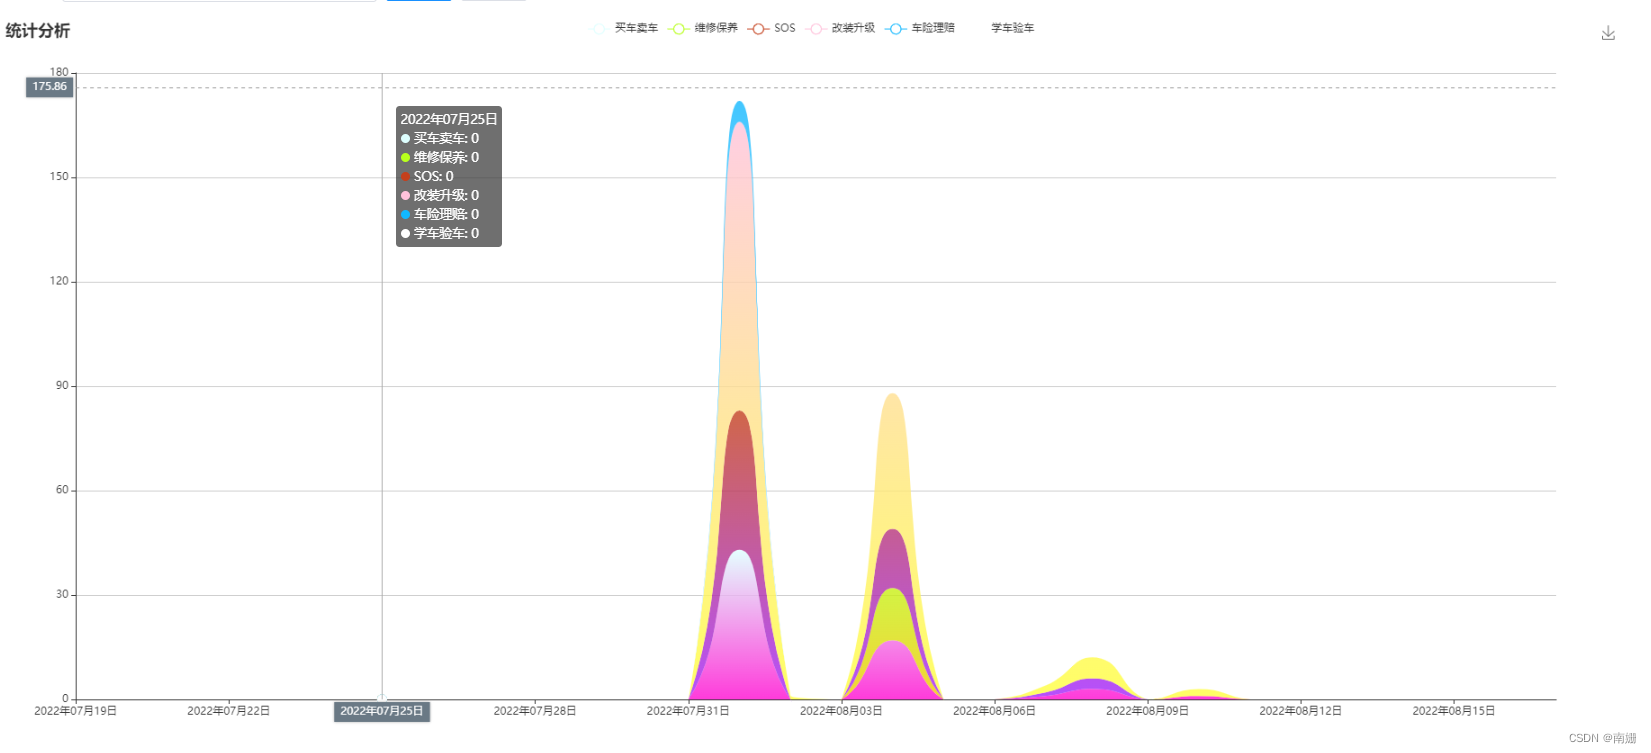
vue调用examples图表

vue调用examples图表

官方网站

https://echarts.apache.org/handbook/zh/

上图
在这里插入图片描述

NPM 安装 ECharts

npm install echarts --save

引入 ECharts

import * as echarts from 'echarts';
或
const echarts = require('echarts')
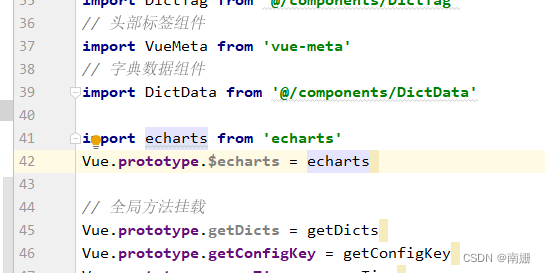
引入全局变量

找到main.js
import echarts from 'echarts'
Vue.prototype.$echarts = echarts

在这里插入图片描述

页面渲染必须规定长宽

<div id="main" :style="{width: '1800px', height: '800px'}"></div>

初始化渲染

domChart(){
		var chartDom = document.getElementById('main');
        var myChart = echarts.init(chartDom);
        let option = {
          title: {
            text: "统计分析",
          },
          color: [],
          tooltip: {
            trigger: 'axis',
            axisPointer: {
              type: 'cross',
              label: {
                backgroundColor: '#6a7985'
              }
            }
          },
          //各数据名称
          legend: {
            data: name,
          },
          xAxis: {
            type: 'category',
            boundaryGap: false,
            //x轴数据集合
            data:time
          },
          yAxis: {
            type: 'value'
          },
          toolbox: {
            feature: {
              saveAsImage: {}
            }
          },
          grid: {
            left: '3%',
            right: '4%',
            bottom: '3%',
            containLabel: true
          },
          //y轴数据和分类
          series: [],

        }
        myChart.setOption(option)
        }

动态加载数据

for (var i = 0; i < name.length; i++) {//legend上面代码集合遍历
              count=[];
              for(let j= 0; j < this.groupList[i].grouplist.length; j++){
                count.push(this.groupList[i].grouplist[j].count)
              }
              let col="rgb(";
              for(let i=0;i<3;i++) col+=parseInt(Math.random()*200)+"%,";
              col=col.substring(0,col.length-1)+")";
              let col1="rgb(";
              for(let i=0;i<3;i++) col1+=parseInt(Math.random()*200)+"%,";
              col1=col1.substring(0,col1.length-1)+")";
              option.color.push(col)//线条颜色与指示颜色相同
              option.series.push(
                  {
                    name: name[i],
                    type: 'line',
                    stack: 'Total',
                    smooth: true,
                    lineStyle: {
                      width: 0
                    },
                    showSymbol: false,
                    areaStyle: {
                      opacity: 0.8,
                      color: new echarts.graphic.LinearGradient(0, 0, 0, 1, [
                        {
                          offset: 0,
                          color: col
                        },
                        {
                          offset: 1,
                          color: col1
                        }
                      ])
                    },
                    emphasis: {
                      focus: 'series'
                    },
                    data: JSON.parse(JSON.stringify(count))}
                )
              }

在这里插入图片描述

先加载数据再渲染

 groupNameList(this.addDateRange(this.queryParams, this.dateRange)).then(response => {//连接后端获取数据
          this.groupList = response.rows;
          this.showCard = true;
          this.drawChart();//上面渲染的方法
        })
  • 0
    点赞
  • 0
    收藏
    觉得还不错? 一键收藏
  • 0
    评论

“相关推荐”对你有帮助么?

  • 非常没帮助
  • 没帮助
  • 一般
  • 有帮助
  • 非常有帮助
提交
评论
添加红包

请填写红包祝福语或标题

红包个数最小为10个

红包金额最低5元

当前余额3.43前往充值 >
需支付:10.00
成就一亿技术人!
领取后你会自动成为博主和红包主的粉丝 规则
hope_wisdom
发出的红包
实付
使用余额支付
点击重新获取
扫码支付
钱包余额 0

抵扣说明:

1.余额是钱包充值的虚拟货币,按照1:1的比例进行支付金额的抵扣。
2.余额无法直接购买下载,可以购买VIP、付费专栏及课程。

余额充值