需求
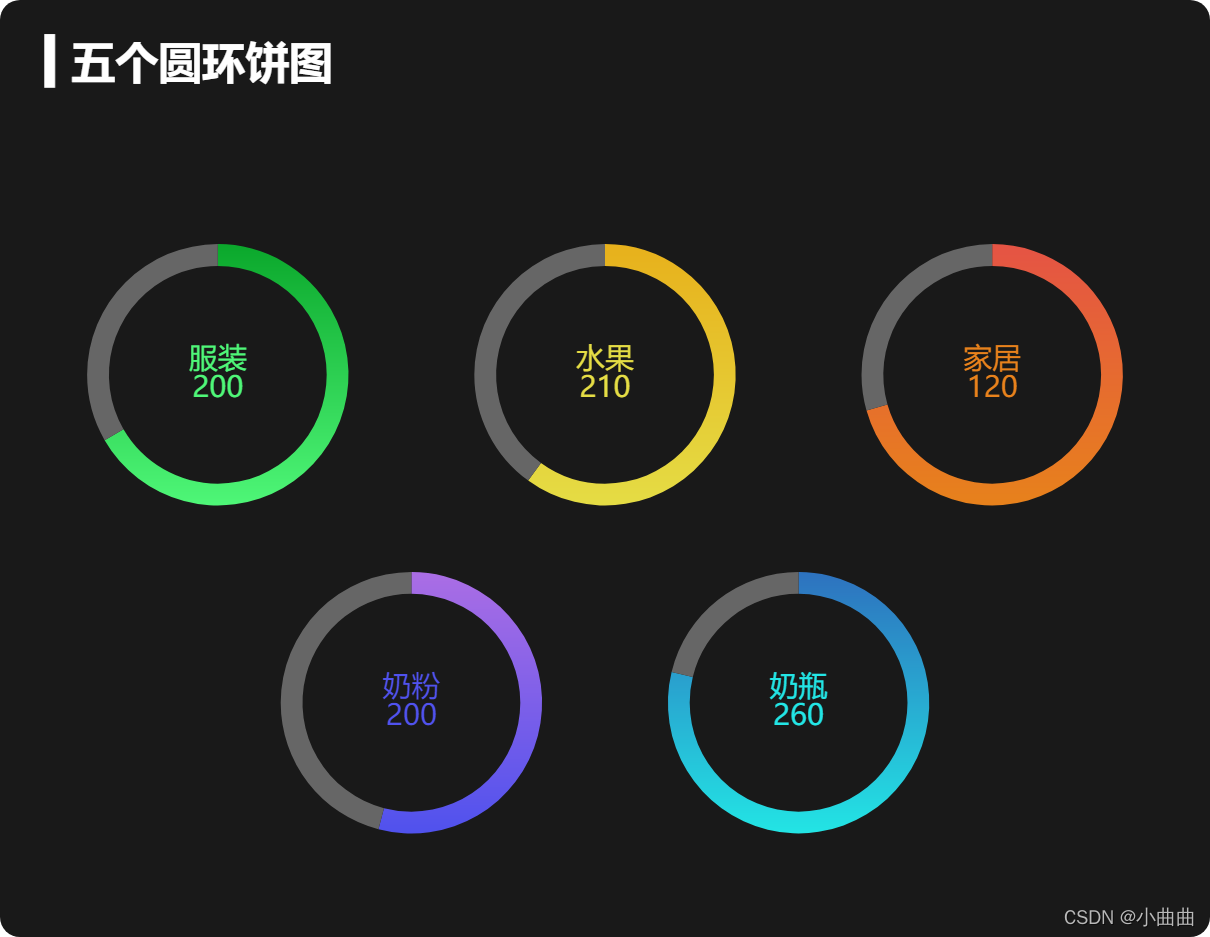
- 需求:圆环饼图
- 1、每个圆环分为左右两部分,分别为每个商品的库存和销量,销量设置为渐变色
- 2、在圆环中心显示该商品名字和销量,设置不同的颜色
- 3、每次展示5个产品的圆环图,定时切换展示下一页商品,这里就不写了
- 4、随着屏幕的变化,适配标题大小和圆环的半径以及内部标签文字的大小
<template>
<div class="w100 h100">
<div ref="looppie" class="w100 h100"></div>
</div>
</template>
<script>
import { ququ } from "../../public/static/theme/ququ";
export default {
data() {
return {
size: null,
looppieChart: null,
looppieData: [
{
name: "服装",
stock: 100,
sales: 200,
},
{
name: "水果",
stock: 140,
sales: 210,
},
{
name: "家居",
stock: 50,
sales: 120,
},
{
name: "奶粉",
stock: 170,
sales: 200,
},
{
name: "奶瓶",
stock: 70,
sales: 260,
},
],
index: 0,
};
},
mounted() {
this.init();
this.getData();
window.addEventListener("resize", this.screenResize);
this.screenResize();
},
beforeDestroy() {
window.removeEventListener("resize", this.screenResize);
},
methods: {
init() {
this.$echarts.registerTheme("ququ", ququ);
this.looppieChart = this.$echarts.init(this.$refs.looppie, "ququ");
let initOption = {
title: {
text: "▍五个圆环饼图",
left: 40,
top: 40,
textStyle: {
color: "#fff",
},
},
};
this.looppieChart.setOption(initOption);
},
getData() {
let positionArr = [
["18%", "40%"],
["50%", "40%"],
["82%", "40%"],
["34%", "75%"],
["66%", "75%"],
];
let colorArr = [
["#4ff778", "#0ba82c"],
["#e5dd45", "#e8b11c"],
["#e8821c", "#e55445"],
["#5052ee", "#ab6ee5"],
["#23e5e5", "#2e72bf"],
];
let seriesArr = this.looppieData.map((item, index) => {
return {
type: "pie",
center: positionArr[index],
label: {
show: true,
position: "center",
color: colorArr[index][0],
},
labelLine: {
show: false,
},
name: item.name,
data: [
{
name: item.name + "\n" + item.sales,
value: item.sales,
itemStyle: {
color: new this.$echarts.graphic.LinearGradient(0, 1, 0, 0, [
{ offset: 0, color: colorArr[index][0] },
{ offset: 1, color: colorArr[index][1] },
]),
},
},
{
value: item.stock,
itemStyle: {
color: "#666",
},
},
],
};
});
let dataOption = {
series: seriesArr,
};
this.looppieChart.setOption(dataOption);
},
screenResize() {
this.$nextTick(() => {
let width = this.$refs.looppie.offsetWidth;
this.size = (width / 100) * 3.6;
let screenOption = {
title: {
textStyle: {
fontSize: this.size,
},
},
series: [
{
type: "pie",
radius: [this.size * 3, this.size * 2.5],
label: {
fontSize: this.size / 1.5,
},
},
{
type: "pie",
radius: [this.size * 3, this.size * 2.5],
label: {
fontSize: this.size / 1.5,
},
},
{
type: "pie",
radius: [this.size * 3, this.size * 2.5],
label: {
fontSize: this.size / 1.5,
},
},
{
type: "pie",
radius: [this.size * 3, this.size * 2.5],
label: {
fontSize: this.size / 1.5,
},
},
{
type: "pie",
radius: [this.size * 3, this.size * 2.5],
label: {
fontSize: this.size / 1.5,
},
},
],
};
this.looppieChart.setOption(screenOption);
this.looppieChart.resize();
});
},
},
};
</script>


 2万+
2万+


 被折叠的 条评论
为什么被折叠?
被折叠的 条评论
为什么被折叠?
 到【灌水乐园】发言


