


P = ( 1 − t ) P 0 + t P 1 P = (1-t) P0 + t P1 P=(1−t)P0+tP1
#include <QWidget>
#include <QApplication>
#include <QPainter>
#include <QPointF>
#include <QPainterPath>

QPointF calculateBezierPoint(float t, const QPointF& P0, const QPointF& P1) {
    return (1 - t) * P0 + t * P1;
}

void LinearBezierCurve(QPainter* painter, const QPointF& P0, const QPointF& P1) {
    float tStep = 0.1f;
    QPainterPath bezierPath;

    QColor curveColor(0, 0, 255);  // 蓝色
    painter->setPen(curveColor);

    for (float t = 0.0f; t <= 1.0f; t += tStep) {
        QPointF P = calculateBezierPoint(t, P0, P1);
        if (t == 0.0f) {
            bezierPath.moveTo(P0);
        } else {
            bezierPath.lineTo(P);
        }
        bezierPath.lineTo(P);
    }
    painter->drawPath(bezierPath);
}

class MyWidget : public QWidget {
public:
    MyWidget(QWidget* parent = nullptr) : QWidget(parent) {
        setFixedSize(800, 600);
    }

protected:
    void paintEvent(QPaintEvent* event) override {
        Q_UNUSED(event);

        QPainter painter(this);
        painter.setRenderHint(QPainter::Antialiasing, true);
        QPoint P0(100, 100);
        QPoint P1(500, 500);
        LinearBezierCurve(&painter, P0,P1);

    }
};


int main(int argc, char* argv[]) {
    QApplication app(argc, argv);

    MyWidget widget;
    widget.show();

    return app.exec();
}
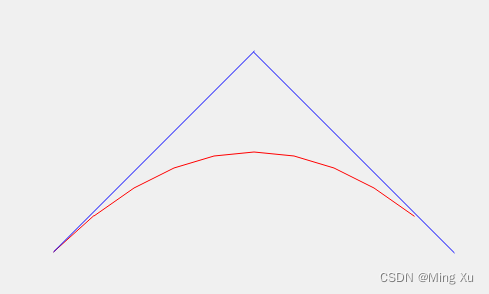
二次
void DrawPolygon(QPainter* painter, const QPointF& P0, const QPointF& P1, const QPointF& P2)
{
    QColor polygonColor(0, 0, 255);  // 蓝色
    painter->setPen(polygonColor);
    painter->drawLine(P0, P1);
    painter->drawLine(P1, P2);

}


QPointF calculateQuadraticBezierPoint(float t, const QPointF& P0, const QPointF& P1, const QPointF& P2) {
    float u = 1 - t;
    return u * u * P0 + 2 * u * t * P1 + t * t * P2;
}

void QuadraticBezierCurve(QPainter* painter, const QPointF& P0, const QPointF& P1, const QPointF& P2) {
    float tStep = 0.1f;
    QPainterPath bezierPath;
    QColor curveColor(255, 0, 0);           // 红色

    painter->setPen(curveColor);
    bezierPath.moveTo(P0);
    for (float t = 0.0f; t <= 1.0f; t += tStep) {
        QPointF P = calculateQuadraticBezierPoint(t, P0, P1, P2);
        bezierPath.lineTo(P);
        }
    painter->drawPath(bezierPath);
}
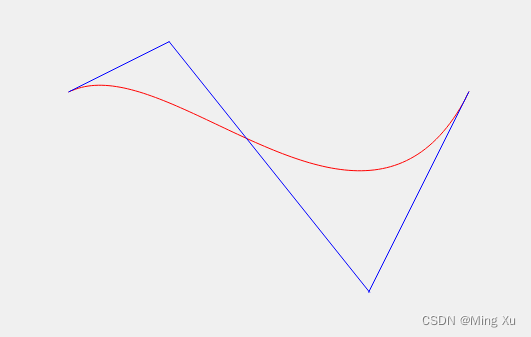
三次
QPointF calculateCubicBezierPoint(float t, const QPointF& P0, const QPointF& P1, const QPointF& P2, const QPointF& P3) {
    float u = 1 - t;
    float b0 = u * u * u;
    float b1 = 3 * u * u * t;
    float b2 = 3 * u * t * t;
    float b3 = t * t * t;
    return b0 * P0 + b1 * P1 + b2 * P2 + b3 * P3;
}

void CubicBezierCurve(QPainter* painter, const QPointF& P0, const QPointF& P1, const QPointF& P2, const QPointF& P3) {
    float tStep = 0.01f;
    QPainterPath bezierPath;
    QColor curveColor(255, 0, 0);  // 红色

    painter->setPen(curveColor);
    bezierPath.moveTo(P0);

    for (float t = tStep; t <= 1.0f; t += tStep) {
        QPointF P = calculateCubicBezierPoint(t, P0, P1, P2, P3);
        bezierPath.lineTo(P);
    }

    painter->drawPath(bezierPath);
}


 2358
2358


 被折叠的 条评论
为什么被折叠?
被折叠的 条评论
为什么被折叠?
 到【灌水乐园】发言


