


插件的下载地址:https://github.com/ProminentEdge/leaflet-measure-path
源码:
<!DOCTYPE html>
<html>
<head>
<meta charset="utf-8" />
<title>Leaflet Measure Path - example</title>
<link rel="stylesheet" href="https://unpkg.com/leaflet@1.0.1/dist/leaflet.css" />
//需下载插件
<link rel="stylesheet" href="./leaflet-measure-path.css" />
<style type="text/css">
body {
padding: 0;
margin: 0;
font-family: sans-serif;
font-size: 10px;
}
#map {
width: 800px;
height: 500px;
}
</style>
</head>
<body>
<div id="map"></div>
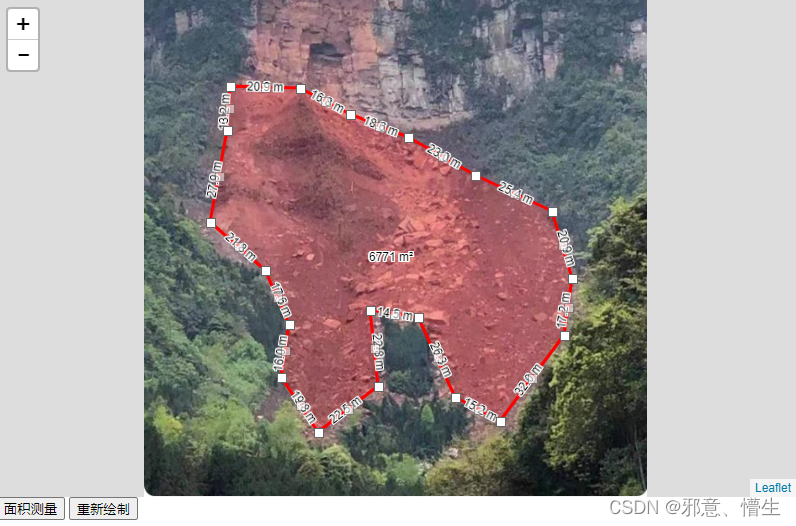
<button id="mesureBtn" onClick="areaMeasure.init()">面积测量</button>
<button id="mesureBtn1" onClick="areaMeasure.destory()">重新绘制</button>
<script src="https://unpkg.com/leaflet@1.0.1/dist/leaflet-src.js"></script>
<script src="https://unpkg.com/leaflet-editable@latest/src/Leaflet.Editable.js" ></script>
<script src="./leaflet-measure-path.js"></script>
<script type="text/javascript">
var map = L.map('map', {
minZoom: 10,
maxZoom: 25,
editable: true
});
// L.tileLayer('http://tile.osm.org/{z}/{x}/{y}.png').addTo(map);
//图片 宽 高
var w = 200, h = 150
w = w / (2 * Math.PI * 6371004) * 360;
h= h / (2 * Math.PI * 6371004) * 360;
map.setView([w/2, h/2], 19)
var imageBounds = [[0, 0], [w, h]];//图片的经纬度范围,西南角点,东北角点(纬度、经度)
var imageUrl='滑坡.png';//图片的地址
var imageLayer =L.imageOverlay(imageUrl, imageBounds,{opacity:1});//opacity是透明度
map.addLayer(imageLayer);
map.setMaxBounds(imageBounds);
//如果imageLayer已经创建,后续只需要切换url即可
if(imageLayer!=null)
{
imageLayer.setUrl(imageUrl);
}
// 面积测量方法
var areaMeasure = {
points:[],
color: "red",
layers: L.layerGroup(),
polygon: null,
init:function(){
areaMeasure.points = [];
areaMeasure.polygon = null;
map.on('click', areaMeasure.click).on('dblclick', areaMeasure.dblclick);
},
close:function(){
var lab = rectangleMeasure.tips.getLabel();
var tt = document.createTextNode(rectangleMeasure.tips.getLabel()._content);
lab._container.innerHTML = "";
lab._container.appendChild(tt);
var span = document.createElement("span");
span.innerHTML = "【关闭】";
span.style.color = "#00ff40";
lab._container.appendChild(span);
L.DomEvent.addListener(span,"click",function(){
rectangleMeasure.destory();
});
},
click:function(e){
map.doubleClickZoom.disable();
// 添加点信息
areaMeasure.points.push(e.latlng);
// 添加面
map.on('mousemove', areaMeasure.mousemove);
},
mousemove:function(e){
areaMeasure.points.push(e.latlng);
if(areaMeasure.polygon)
map.removeLayer(areaMeasure.polygon);
areaMeasure.polygon = L.polygon(areaMeasure.points,{showMeasurements: true, color: 'red'});
//areaMeasure.polygon.addTo(map);
areaMeasure.polygon.addTo(areaMeasure.layers);
areaMeasure.layers.addTo(map);
areaMeasure.points.pop();
},
dblclick:function(e){ // 双击结束
areaMeasure.polygon.addTo(areaMeasure.layers);
areaMeasure.polygon.enableEdit();
map.on('editable:vertex:drag editable:vertex:deleted', areaMeasure.polygon.updateMeasurements, areaMeasure.polygon);
map.off('click', areaMeasure.click).off('mousemove', areaMeasure.mousemove).off('dblclick', areaMeasure.dblclick);
},
destory:function(){
if(areaMeasure.polygon)
map.removeLayer(areaMeasure.polygon);
this.init()
}
}
//测试数据 =====
var polygon = L.polygon([
[57.69, 11.89],
[57.697, 11.88],
[57.71, 11.89],
[57.71, 11.91],
[57.69, 11.91]
], {showMeasurements: true})
.addTo(map);
L.polyline([
[57.67, 11.85],
[57.677, 11.86],
[57.68, 11.85],
[57.69, 11.86],
], {showMeasurements: true, measurementOptions: {imperial:true}})
.addTo(map);
L.circle([57.694, 11.94], 1000, {showMeasurements: true})
.addTo(map);
L.circle([57.705, 11.92], 750, {showMeasurements: true, measurementOptions: {imperial:true}})
.addTo(map);
polygon.enableEdit();
map.on('editable:vertex:drag editable:vertex:deleted', polygon.updateMeasurements, polygon);
</script>
</body>
</html>


 1232
1232


 被折叠的 条评论
为什么被折叠?
被折叠的 条评论
为什么被折叠?
 到【灌水乐园】发言


