


1、概述
Prometheus默认将数据储存在本地的TSDB(时序数据库)中,这种设计较大地简化了Promethes的部署难度,但与此同时也存在着一些问题。
首先是数据持久化的问题,原生的TSDB对于大数据量的保存及查询支持不太友好 ,并不适用于保存长期的大量数据;另外,该数据库的可靠性也较弱,在使用过程中容易出现数据损坏等故障,且无法支持集群的架构。
为了满足这方面的需求,Prometheus提供了remote_write和remote_read的特性,支持将数据存储到远端和从远端读取数据的功能。当配置remote_write特性后,Prometheus会将采集到的指标数据通过HTTP的形式发送给适配器(Adaptor),由适配器进行数据的存入。而remote_read特性则会向适配器发起查询请求,适配器根据请求条件从第三方存储服务中获取响应的数据。
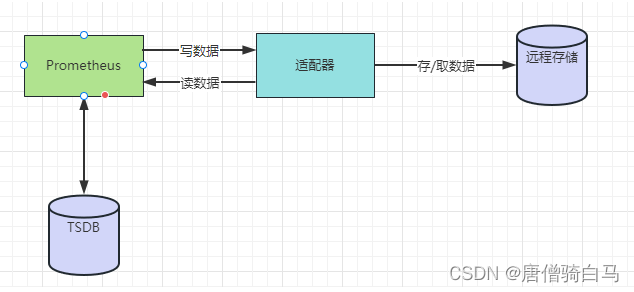
使用接口的存储方式,符合Prometheus追求简洁的设计理念,一方面可以减少与远程存储的耦合性,避免因存储问题而导致服务中断;另一方面通过将监控与数据分离,Prometheus也降低了自身设计的复杂性,能够更好地进行弹性扩展。
在Prometheus社区中,目前已经有不少远程存储的支持方案,下面列出了其中的部分方案,完整内容可参见官网。AppOptics: write
- Chronix: write
- Cortex: read and write
- CrateDB: read and write
- Elasticsearch: write
- Gnocchi: write
- Graphite: write
- InfluxDB: read and write
- Kafka: write
- OpenTSDB: write
- PostgreSQL/TimescaleDB: read and write
- Splunk: read and write
在这些解决方案中,有些只支持写入操作,不支持读取,有些则支持完整的读写操作。
在本文的示例中,我们将使用InfluxDB来做为我们远程存储的方案。
2、InfluxDB简介
InfluxDB是业界流行的一款时间序列数据库,其使用go语言开发。InfluxDB以性能突出为特点,具备高效的数据处理和存储能力,目前在监控和IOT 等领域被广泛应用。

产品具有以下特点:
- 自定义的TSM引擎,数据高速读写和压缩等功能。
- 简单、高性能的HTP查询和写入API。
- 针对时序数据,量身打造类似SQL的查询语言,轻松查询聚合数据。
- 允许对tag建索引,实现快速有效的查询。
- 通过保留策略,可有效去除过期数据
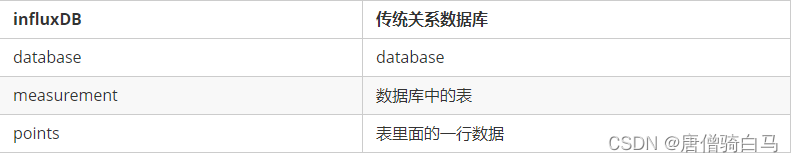
与传统关系数据库的名词对比:
于InfluxDB的更多内容可参见官文文档:https://docs.influxdata.com/influxdb/v1.8,本文不做过多介绍。
3、安装InfluxDB
3.1 配置yum源
cat <<EOF | sudo tee /etc/yum.repos.d/influxdb.repo
[influxdb]
name = InfluxDB Repository - RHEL \$releasever
baseurl = https://repos.influxdata.com/rhel/\$releasever/\$basearch/stable
enabled = 1
gpgcheck = 1
gpgkey = https://repos.influxdata.com/influxdb.key
EOF
3.2 安装InfluxDB
yum -y install influxdb
如果yum安装失败可以尝试下载rpm包
wget https://dl.influxdata.com/influxdb/releases/influxdb-1.8.0.x86_64.rpm
sudo yum localinstall influxdb-1.8.0.x86_64.rpm
3.3 启动InfluxDB
systemctl start influxdb
3.4 查看进程状态,已启动
[root@grafana ~]# ps aux |grep influxdb
influxdb  75502  0.8  1.4 914520 29888 ?        Ssl  21:18   0:00 /usr/bin/influxd -config /etc/influxdb/influxdb.conf
root      75571  0.0  0.0 112812   972 pts/0    S+   21:18   0:00 grep --color=auto influxdb
3.5 登录InfluxDB
[root@grafana ~]# influx
Connected to http://localhost:8086 version 1.8.0
InfluxDB shell version: 1.8.0
>
3.6 创建名称为prometheus的库
create database prometheus
查看数据库已生成,目前为空库,还未有数据。
> show databases
name: databases
name
----
_internal
prometheus
注意:默认情况下,InfluxDB会禁用身份验证,并且所有用户都具有全部权限,这样并不安全。在正式环境中,建议启用InfluxDB的身份验证功能。
4、安装适配器
4.1 下载Prometheus源码文件
git clone https://github.com/prometheus/prometheus.git
4.2 编译remote_storage_adapter源码文件
使用go编译remote_storage_adapter源码文件,并将生成的二进制文件拷贝到bin目录。
安装go环境
wget https://golang.google.cn/dl/go1.19.7.linux-amd64.tar.gz
tar zxvf go1.19.7.linux-amd64.tar.gz -C /usr/local/
vim /etc/profile
export PATH=$PATH:/usr/local/go/bin
source /etc/profile
go version
cd ./prometheus/documentation/examples/remote_storage/remote_storage_adapter
go build
mv remote_storage_adapter  /usr/local/bin/
go build时代理超时,重新设置代理即可
github.com/prometheus/prometheus@v0.42.0: Get “https://proxy.golang.org/github.com/prometheus/prometheus/@v/v0.42.0.zip”: dial tcp 142.251.42.241:443: connect: connection refused
# linux
go env -w GOPROXY=https://goproxy.cn,direct

#Windows
# Enable the go modules feature
$env:GO111MODULE="on"
# Set the GOPROXY environment variable
$env:GOPROXY="https://goproxy.io"
4.3 启动适配器,并连接influxdb
remote_storage_adapter --influxdb-url=http://localhost:8086/ --influxdb.database=prometheus --influxdb.retention-policy=autogen &
4.4 查看态
默认端口为9201,查看端口状态可看到实例已正常启动
netstat -lnpt |grep 9201
tcp6       0      0 :::9201                 :::*                    LISTEN      3428/remote_storage
[root@grafana ~]# lsof -i:9201
COMMAND      PID USER   FD   TYPE  DEVICE SIZE/OFF NODE NAME
remote_st 115624 root    4u  IPv6 1372544      0t0  TCP *:wap-wsp-wtp (LISTEN
5、Prometheus配置
完成前面组件的部署后,我们只要在Prometheus中配置远程读写功能,并指定对应的url和端口即可。
remote_write和remote_read的具体配置可参见如下内容:
remote_write:
    url: <string>
    [ remote_timeout: <duration> | default = 30s ]
    write_relabel_configs:
    [ - <relabel_config> ... ]
    basic_auth:
    [ username: <string> ]
    [ password: <string> ]
    [ bearer_token: <string> ]
    [ bearer_token_file: /path/to/bearer/token/file ]
    tls_config:
    [ <tls_config> ]
    [ proxy_url: <string> ]
remote_read:
    url: <string>
    required_matchers:
    [ <labelname>: <labelvalue> ... ]
    [ remote_timeout: <duration> | default = 30s ]
    [ read_recent: <boolean> | default = false ]
    basic_auth:
    [ username: <string> ]
    [ password: <string> ]
    [ bearer_token: <string> ]
    [ bearer_token_file: /path/to/bearer/token/file ]
    [ <tls_config> ]
    [ proxy_url: <string> ]
注释 :其中url用于指定远程读写的HTTP服务地址,如果该URL启动了认证则可以通过basic_auth进行安全认证配置;对于https的支持需要设定tls_concig;proxy_url主要用于Prometheus无法直接访问适配器服务的情况下;write_relabel_configs用于标签重写功能。
tar -cvf prometheus.tar prometheus/
tar -xvf prometheus.tar
修改prometheus.yml文件,添加远程读写的配置内容:
remote_write:
  - url: "http://192.168.75.161:9201/write"
remote_read:
  - url: "http://192.168.75.161:9201/read"
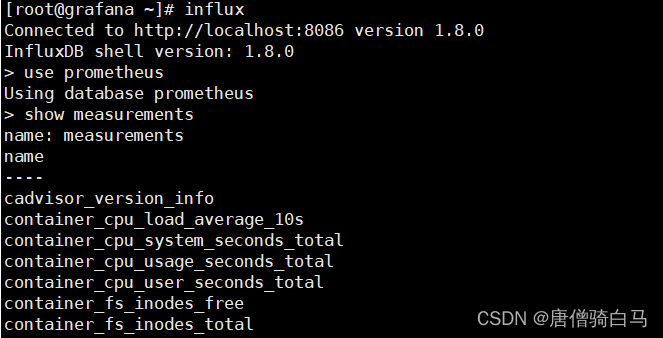
配置完成后,重启Prometheus。在实例启动后,我们可以看到InfluxDB已经开始存储监控指标。
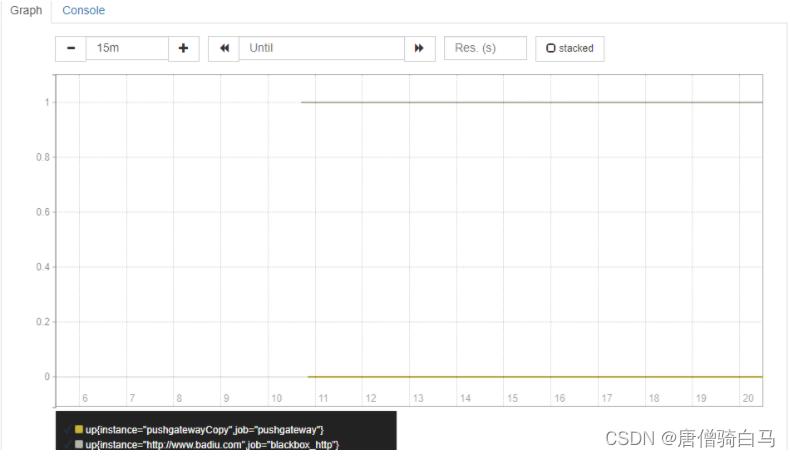
在数据写入成功后,我们可以试着停止Prometheus服务,同时删除本地data目录的监控数据,模拟Promthues数据丢失的情况后重启服务。重新打开Prometheus后,如果还可以正常查询到本地存储已删除的历史数据记录,则代表配置正常。
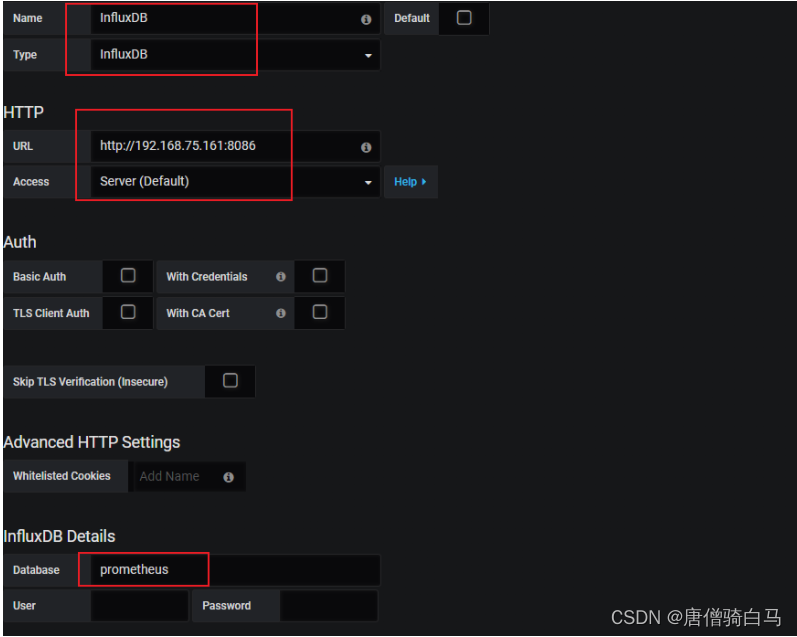
6、Grafana配置influxdb数据源
添加url地址,添加创建的Prometheus数据库,点击测试连接
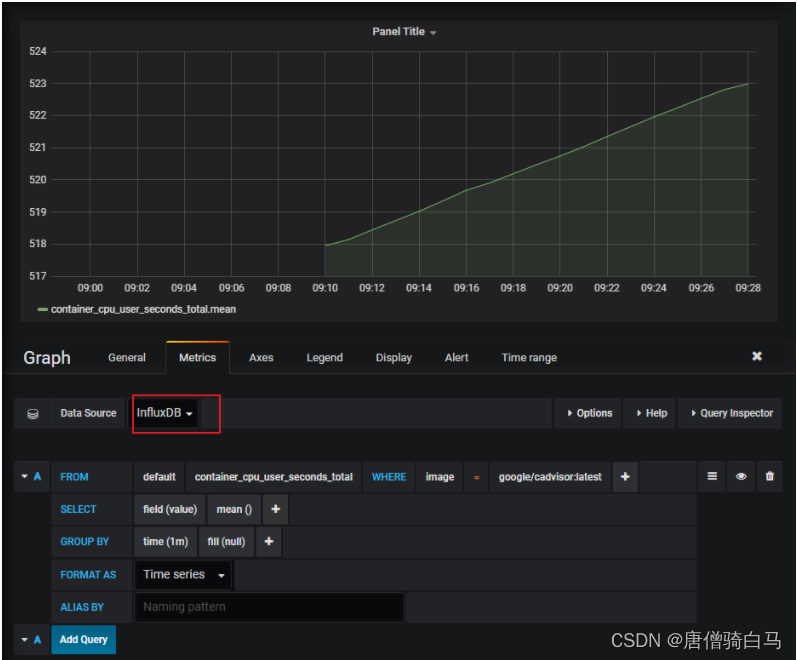
Grafana上测试
上一篇:Prometheus监控实战系列二十一:容量管理
下一篇:Prometheus监控实战系列二十三:高可用与扩展性


 5451
5451


 被折叠的 条评论
为什么被折叠?
被折叠的 条评论
为什么被折叠?
 到【灌水乐园】发言


