


<template>
<div>
<div id="chartId" class="chartRef" style="width: 600px; height: 400px;"></div>
</div>
</template>
<script setup lang="ts">
import * as echarts from "echarts";
import { onMounted } from 'vue';
const colorStyle = [[1,new echarts.graphic.LinearGradient(
0, 0, 1, 0, [
{
offset: 0,
color: 'rgba(22, 148, 255, 0.1)',
},
{
offset: 1,
color:'rgba(63, 250, 250, 0.9)',
}
]
)]]
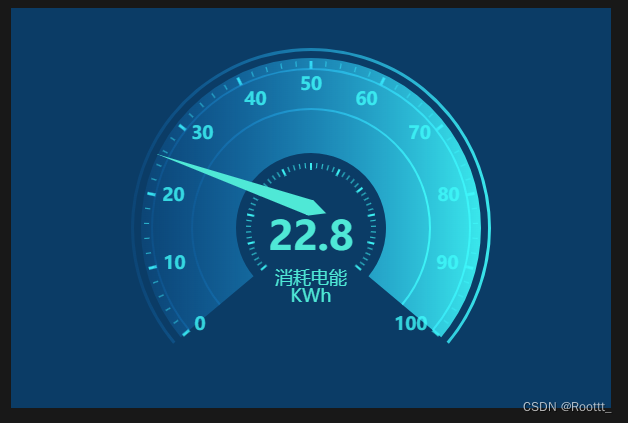
const option = {
backgroundColor: "#0b3c66",
series: [
//最外的圆圈(外层刻度)
{
type: 'gauge',
center: [
'50%',
'55%'
],
radius: '90%',
startAngle: 220,
endAngle: -40,
min: 0,
max: 100,
axisLine: {
show: true,
lineStyle: {
width: 3,
color:colorStyle
}
},
axisLabel: {
show: 0
},
axisTick: {
lineStyle: {
color:'rgba(63,250,250,0.7)',
width: 1
},
length: 5
},
splitLine: {
length: 8,
lineStyle: {
color:'rgba(63,250,250,0.8)',
width: 3
}
},
},
// 外围刻度(第二层)
{
type: 'gauge',
center: [
'50%',
'55%'
],
radius: '80%', // 1行3个
min: 0,
max: 100,
startAngle: 220,
endAngle: -40,
axisLine: { // 坐标轴线
lineStyle: { // 属性lineStyle控制线条样式
color: colorStyle,
fontSize: 20,
width: 2,
opacity: 1, //刻度背景宽度
}
},
splitLine: {
show: false
},
axisLabel: {
show: false
},
axisTick: {
show: false
},
},
// 外围刻度(中间有背景颜色那块,包括里面的刻度)
{
type: 'gauge',
center: [
'50%',
'55%'
],
radius: '85%', // 1行3个
splitNumber: 10,
min: 0,
max: 100,
startAngle: 220,
endAngle: -40,
//分隔线样式
axisTick: {
lineStyle: {
color:'rgba(63,250,250,0.8)',
width: 1
},
length: 5
},
//刻度样式
axisLine: {
show: true,
lineStyle: {
width: 95,
color: colorStyle
}
},
//整数分隔线
splitLine: {
show: true,
length: 7,
lineStyle: {
color:'rgba(63, 250, 250, 0.8)',
width: 2
}
},
//刻度数字
axisLabel: {
show: true,
distance: 1,
textStyle: {
color:'rgba(63, 250, 250, 0.8)',
fontSize: '18',
fontWeight: 'bold'
}
},
},
//从外数第三条线
{
type: 'gauge',
center: [
'50%',
'55%'
],
radius: '60%', // 1行3个
splitNumber: 10,
min: 0,
max: 100,
startAngle: 220,
endAngle: -40,
axisLine: { // 坐标轴线
lineStyle: { // 属性lineStyle控制线条样式
color: colorStyle,
fontSize: 20,
width: 2,
opacity: 1, //刻度背景宽度
}
},
splitLine: {
show: false
},
axisLabel: {
show: false
},
pointer: {
show: false
},
axisTick: {
show: false
},
detail: {
show: 0
}
},
// 内侧指针、数值显示
{
name: '',
center: [
'50%',
'50%'
],
type: 'gauge',
radius: '80%', // 1行3个
splitNumber: 10,
min: 0,
max: 100,
startAngle: 220,
endAngle: -40,
axisLine: {
show: true,
lineStyle: {
width: 50,
color: [
[
1,
new echarts.graphic.LinearGradient(
0, 0, 1, 0, [
{
offset: 0,
color: 'rgba(0, 199, 187, 0)',
},
{
offset: 1,
color: 'rgba(0, 199, 187, 0)',
}
]
)
],
]
}
},
axisTick: {
show: 0,
},
splitLine: {
show: 0,
},
axisLabel: {
show: 0
},
pointer: {
show: true,
length: '102%',
width: 8,
itemStyle: {
color:colorStyle
}
},
data: [
{
value: 22.8,
name: '消耗电能\nKWh',
title: {
offsetCenter: ['0%', '50%'],
fontSize: 18,
color:'#4fe8d6'
},
detail: {
offsetCenter: ['0%', '20%'],
valueAnimation: true,
fontSize: 40,
color:'#4fe8d6'
}
}
]
}
]
};
onMounted(() => {
let myChart = echarts.init(document.getElementById("chartId"));
myChart.setOption(option)
window.addEventListener('resize', function () {
myChart.resize()
})
})
</script>


 1395
1395


 被折叠的 条评论
为什么被折叠?
被折叠的 条评论
为什么被折叠?
 到【灌水乐园】发言


