


vmstat命令
使用vmstat命令分析虚拟内存数据
vmstat 5 #每隔5秒输出1组数据
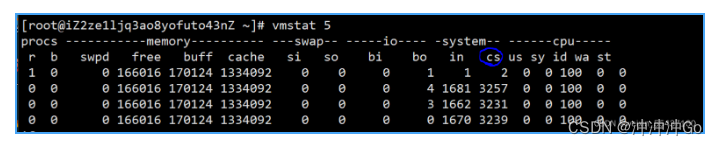
cs(context switch)是每秒上下文切换的次数。
in(interrupt)则是每秒中断的次数。
r(Running or Runnable)是就绪队列的长度,也就是正在运行和等待 CPU 的进程数。
b(Blocked)则是处于不可中断睡眠状态的进程数。
us(User) 用户态运行占比
这里重点关注cs列
vmstat 只给出了系统总体的上下文切换情况,要想查看每个进程的详细情况,需要用 pidstat 命令。给它加上 -w 选项,你就可以查看每个进程上下文切换的情况了(-w参数:Report task switching activity (kernels 2.6.23 and later only).)。
pidstat 命令
pidstat -w 5 # 每隔5秒输出
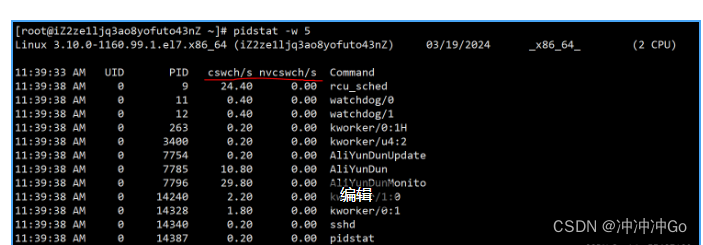
这个结果中有两列内容是我们的重点关注对象。一个是 cswch ,表示每秒自愿上下文切换(voluntary context switches)的次数,另一个则是 nvcswch ,表示每秒非自愿上下文切换(non voluntary context switches)的次数。
自愿上下文切换:是指进程无法获取所需资源,导致的上下文切换。比如说, I/O、内存等系统资源不足时,就会发生自愿上下文切换(cswch/s: Total number of voluntary context switches the task made per second. A voluntary context switch occurs when a task blocks because it requires a resource that is unavailable.)。
非自愿上下文切换:是指进程由于时间片已到等原因,被系统强制调度,进而发生的上下文切换。比如说,大量进程都在争抢 CPU 时,就容易发生非自愿上下文切换。(nvcswch/s:Total number of non voluntary context switches the task made per second. A invol‐ untary context switch takes place when a task executes for the duration of its time slice and then is forced to relinquish the processor.)
每秒上下文切换多少次才算正常呢?
“这个数值其实取决于系统本身的 CPU 性能。在我看来,如果系统的上下文切换次数比较稳定,那么从数百到一万以内,都应该算是正常的。但当上下文切换次数超过一万次,或者切换次数出现数量级的增长时,就很可能已经出现了性能问题。这时,你还需要根据上下文切换的类型,再做具体分析。比方说:自愿上下文切换变多了,说明进程都在等待资源,有可能发生了 I/O 等其他问题;非自愿上下文切换变多了,说明进程都在被强制调度,也就是都在争抢 CPU,说明 CPU 的确成了瓶颈;中断次数变多了,说明 CPU 被中断处理程序占用,还需要通过查看 /proc/interrupts 文件来分析具体的中断类型。”


 1432
1432


 被折叠的 条评论
为什么被折叠?
被折叠的 条评论
为什么被折叠?
 到【灌水乐园】发言


