


这个问题真的很无语,首先自己是用官网的例子,但是奇怪的是照搬到自己的代码里面都没有显示。因为自己用的是axios请求过来的数据,所有一开始怀疑自己封装的数据有问题,但是并不是,因为我试了不管是请求来的数据还是静态数据都一样不显示图形。
用的官网例子如下:
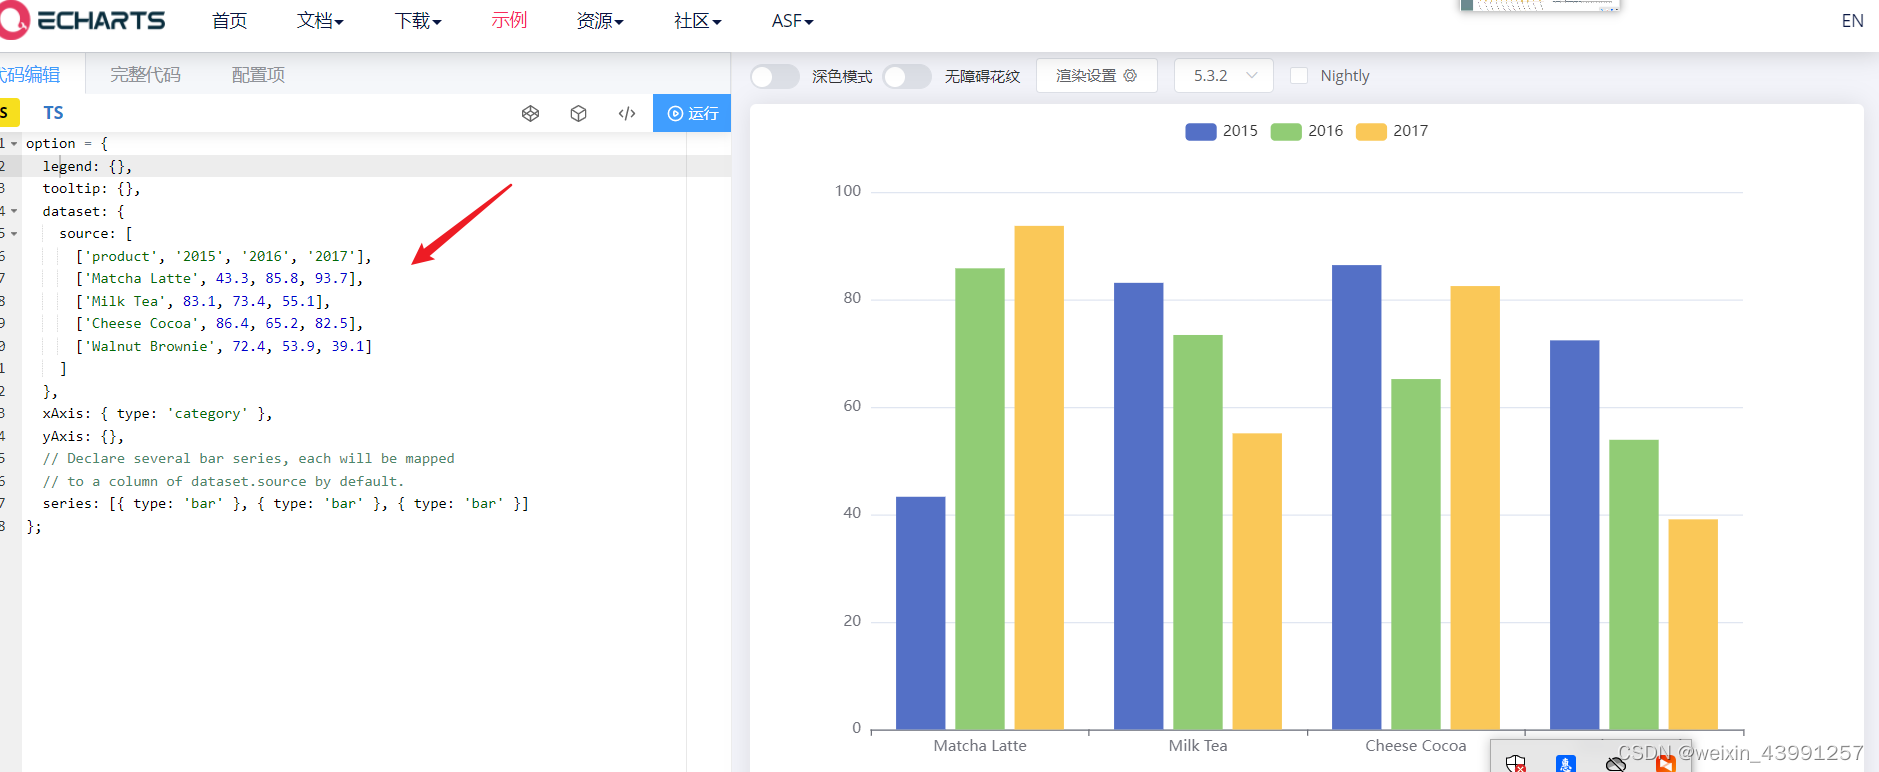
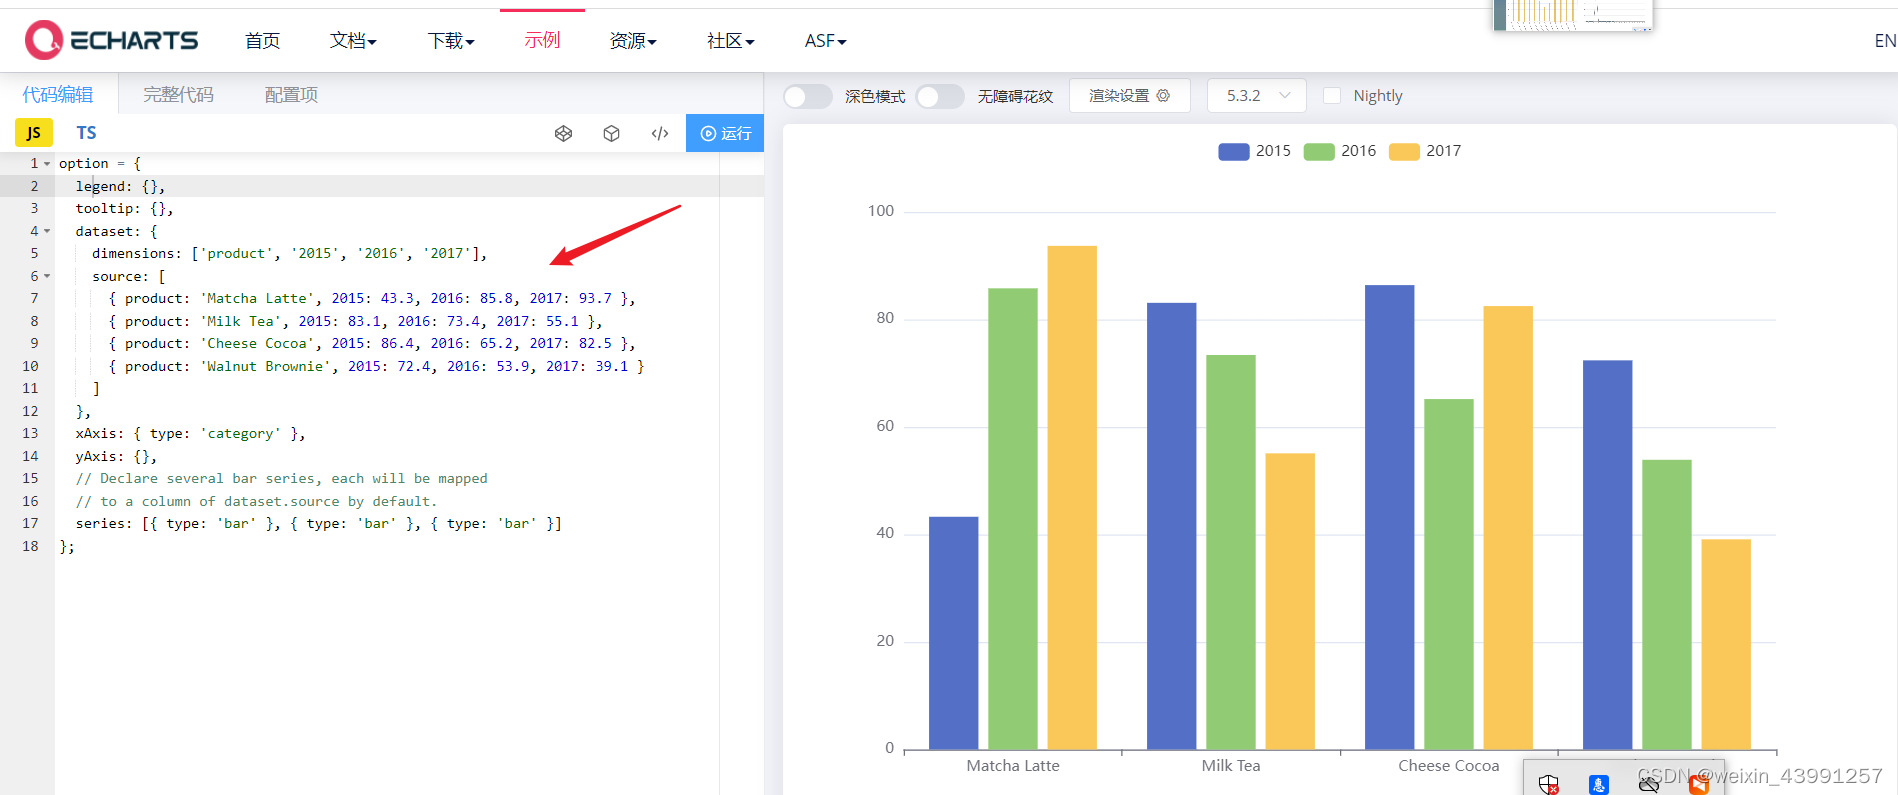
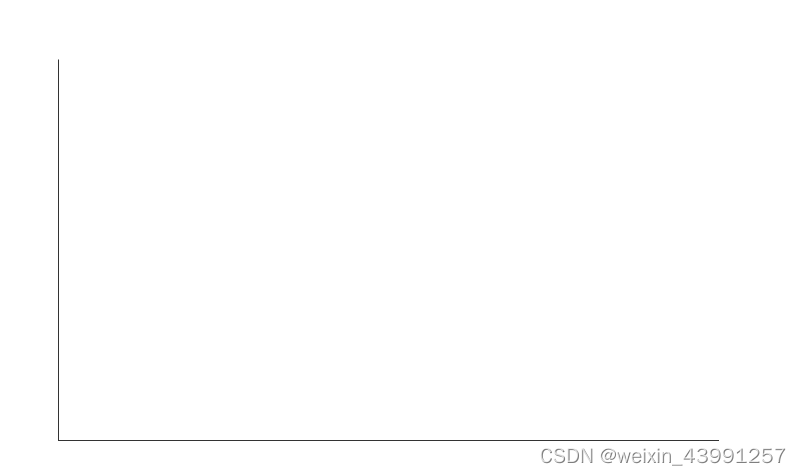
照搬上图两个的实例都是图形空白的结果!!!!!!!!!
如下显示:只有两根坐标线。
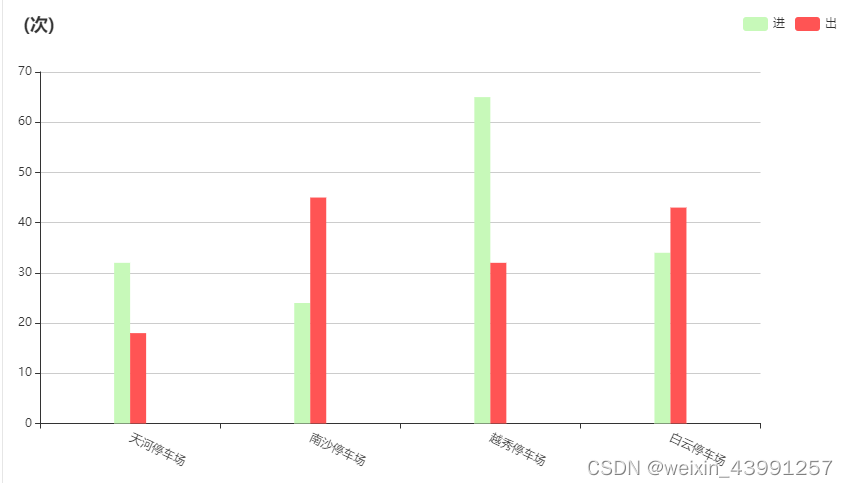
后来在想可能是官网写法不支持,所以改用了serise里面写数据,结果通了!
代码如下:
option = {
            title: {
                text: '(次)'
            },
            tooltip: {
                trigger: 'axis',
                axisPointer: {
                    type: 'cross',
                    crossStyle: {
                        color: '#999'
                    }
                }
            },
            legend: {
                data: ["进","出"],
                right: 1,
            },
            grid: {
                left: '0%',
                containLabel: true
            },
            xAxis: {
                type: 'category',
                data:["天河停车场","南沙停车场","越秀停车场","白云停车场"],
                axisLabel:{
                    show:true,
                    align:'left',
                    interval:0,
                    rotate:-25,
                    margin:14,
                },
            },
            yAxis: {
                type: 'value',
            },
            series: [
                {
                    name: "进",
                    type: 'bar',
                    data: [32,24,65,34],
                    barWidth: 16,//柱子粗细
                    barGap:0,//柱子间距
                    itemStyle:{
                        normal:{
                            color:'#c7f9b9'
                        },
                    },
                    smooth: true,
                },
                {
                    name: "出",
                    type: 'bar',
                    barWidth: 16,//柱子粗细
                    data: [18,45,32,43],
                    itemStyle:{
                        normal:{
                            color:'#ff5454'
                        },
                    },
                    smooth: true,
                }
            ]

        };
效果如下:


 1316
1316


 被折叠的 条评论
为什么被折叠?
被折叠的 条评论
为什么被折叠?
 到【灌水乐园】发言


