


1、安装prometheus和grafana的服务器开通9090和3000端口
firewall-cmd --zone=public --add-port=9090/tcp --permanent
firewall-cmd --zone=public --add-port=3000/tcp --permanent
firewall-cmd --reload
systemctl stop docker
systemctl restart docker
2、拉取prometheus和grafana镜像
docker pull prom/prometheus:v2.35.0
docker pull grafana/grafana:8.5.2
3、将prometheus.yml放到/home/prometheus目录下
prometheus.yml参考如下:
# my global config
global:
scrape_interval: 10s # 采集数据的间隔时间,s为秒,m为分钟
evaluation_interval: 10s # 计算已采集的数据的间隔时间,s为秒,m为分钟
# scrape_timeout is set to the global default (10s).
# Alertmanager configuration
alerting:
alertmanagers:
- static_configs:
- targets:
# - alertmanager:9093
# Load rules once and periodically evaluate them according to the global 'evaluation_interval'.
rule_files:
# - "first_rules.yml"
# - "second_rules.yml"
scrape_configs:
# The job name is added as a label `job=<job_name>` to any timeseries scraped from this config.
- job_name: 'prometheus'
static_configs:
- targets: ['localhost:9090']
# 从每台安装node_exporter的服务器获取数据
- job_name: 'node_exporter'
static_configs:
- targets: ['192.168.0.61:9100','192.168.0.19:9100']
4、构建并启动prometheus容器
docker run -d -name prometheus \
-p 9090:9090 \
-v /home/prometheus/prometheus.yml:/etc/prometheus/prometheus.yml \
prom/prometheus:v2.35.0
5、构建并启动grafana容器
docker run -d -p 3000:3000 --user 472 --name grafana grafana/grafana:8.5.2
grafana首次登录默认账号密码
http://ip:3000
admin/admin
6、在需要被监控的服务器安装node_exporter,需要开放该服务器的9100端口
node_exporter
1.下载node_exporter-1.3.1.linux-amd64.tar.gz文件并上传到服务器/home/exporter/目录下
https://github.com/prometheus/node_exporter/releases/download/v1.3.1/node_exporter-1.3.1.linux-amd64.tar.gz
2.解压node_exporter
cd /home/exporter/
tar -xvzf node_exporter-1.3.1.linux-amd64.tar.gz
3、进入工作目录
cd /home/exporter/node_exporter-1.3.1.linux-amd64
4.、启动node_exporter服务
nohup ./node_exporter &
5、测试是否启动成功
http://ip:9100/metrics
7、在需要被监控的mysql服务器安装mysqld_exporter,需要开放该服务器的9104端口
mysqld_exporter
1.下载mysqld_exporter-0.14.0.linux-amd64.tar.gz文件并上传到服务器/home/exporter/目录下
https://github.com/prometheus/mysqld_exporter/releases/download/v0.14.0/mysqld_exporter-0.14.0.linux-amd64.tar.gz
2.解压mysqld_exporter
cd /home/exporter/
tar -xvzf mysqld_exporter-0.14.0.linux-amd64.tar.gz
3、进入工作目录
cd /home/exporter/mysqld_exporter-0.14.0.linux-amd64
4、在mysql数据库创建一个exporter的用户
CREATE USER 'exporter'@'localhost' IDENTIFIED BY 'mima' WITH MAX_USER_CONNECTIONS 3;
GRANT PROCESS, REPLICATION CLIENT, SELECT ON *.* TO 'exporter'@'localhost';
FLUSH PRIVILEGES
5.启动mysqld_exporter服务
export DATA_SOURCE_NAME='exporter:mima@(localhost:3306)/'
nohup ./mysqld_exporter &
6、测试是否启动成功
http://ip:9104/metrics
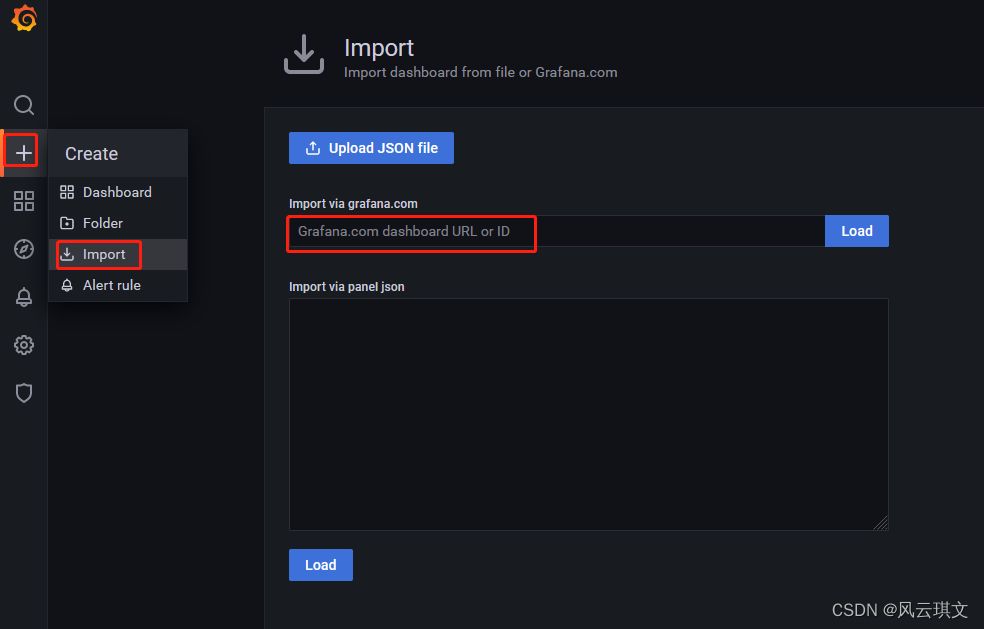
8、在grafana中导入监控服务器的仪表盘和监控mysql的仪表盘
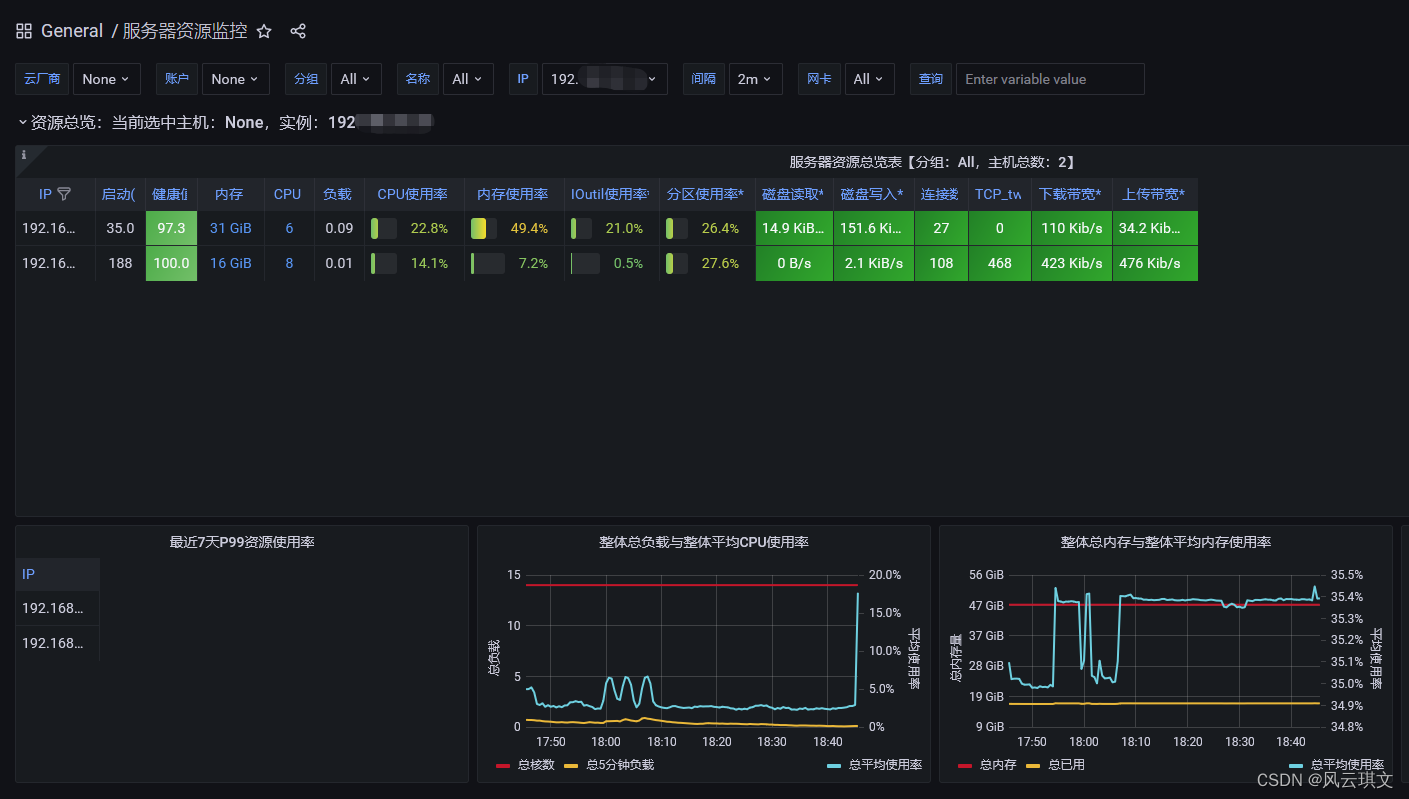
监控服务器的仪表盘ID:8919
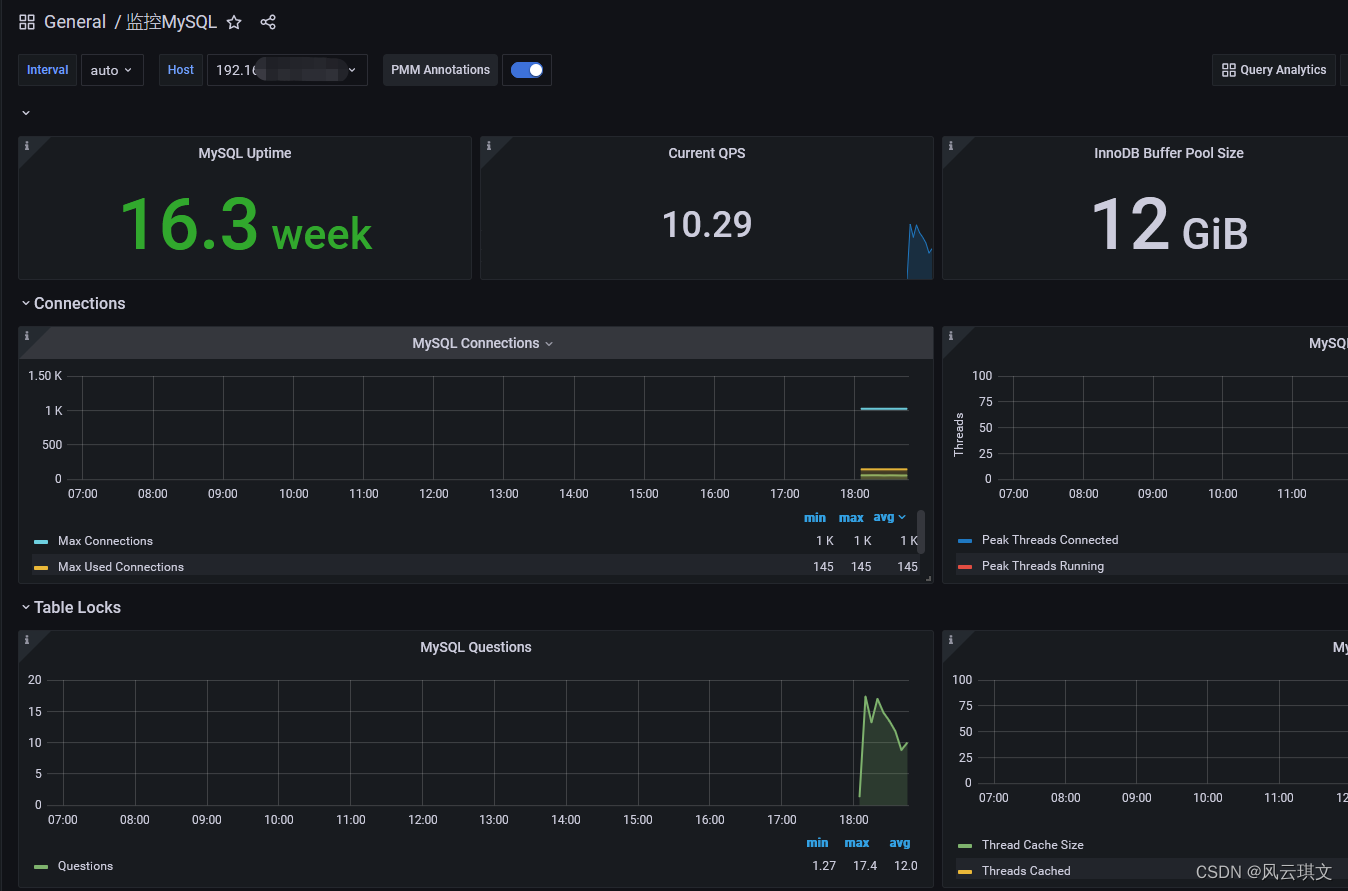
监控mysql的仪表盘ID:7362
9、效果截图
其他:
官方推荐的exporter
https://prometheus.io/docs/instrumenting/exporters/
仪表盘清单
https://grafana.com/grafana/dashboards


 920
920


 被折叠的 条评论
为什么被折叠?
被折叠的 条评论
为什么被折叠?
 到【灌水乐园】发言


