


 本文介绍了如何在Matlab中使用分段函数绘制曲线,包括使用分段条件和插值方法(如最近邻、双线性和双三次插值)。同时,详细展示了如何通过xyplot.m函数自定义坐标轴和标签,提供了一个示例代码以实现坐标轴的变换。
想要的效果:
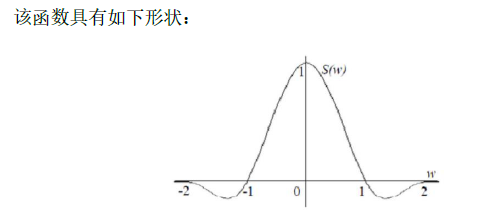
编程时要用到分段函数曲线的绘制方法:..+.*(分段条件)。
需要注意的是:函数表达式中的乘除和乘方都要加“.”。因为一般的函数都是数在乘变量运算。
x=-2:0.001:2;
a=-0.5;
w=abs(x);
y=(1.5.*w.^3-2.5.*w.^2+1).*(w<=1)+(-0.5.*w.^3+2.5.*w.^2-4.*w+2).*(w>1&w<=2);
plot(x,y);
box off;
view([1 90]);
xlabel('w');
ylabel('S(w)');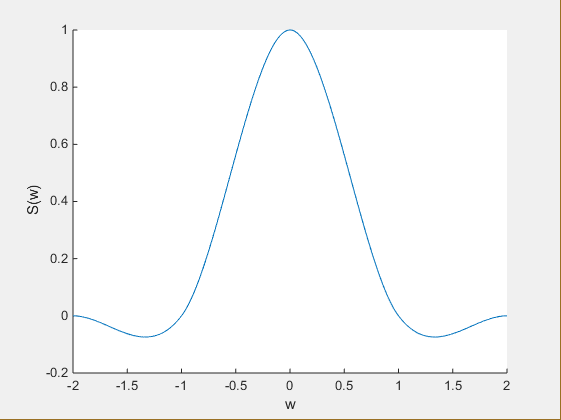
然后想将坐标轴变一下:
新建一个xyplot.m文件:
function xyplot(x,y)
% xyplot Plot 2D axes through the origin
%   Example 1:
%   t = linspace(0,2*pi,500);
%   y1 = 80*sin(t);
%   y2 = 100*cos(t);
%   xyplot(t,[y1;y2])
%
%   Example 2:
%   x = -2*pi:pi/10:2*pi;
%   y = sin(x);
%   plot(x,y)
%   xyplot
% PLOT
if nargin>0
    if nargin == 2
     plot(x,y);
    else
    display('Not 2D Data set!')
    end
end
hold on;
% GET TICKS
X=get(gca,'Xtick');
Y=get(gca,'Ytick');
% GET LABELS
XL=get(gca,'XtickLabel');
YL=get(gca,'YtickLabel');
% GET OFFSETS
Xoff=diff(get(gca,'XLim'))./40;
Yoff=diff(get(gca,'YLim'))./40;
% DRAW AXIS LINEs
plot(get(gca,'XLim'),[0 0],'k');
plot([0 0],get(gca,'YLim'),'k');
% Plot new ticks
for i=1:length(X)
    plot([X(i) X(i)],[0 Yoff],'-k');
end;
for i=1:length(Y)
    plot([Xoff, 0],[Y(i) Y(i)],'-k');
end;
% ADD LABELS
text(X,zeros(size(X))-2.*Yoff,XL);
text(zeros(size(Y))-3.*Xoff,Y,YL);
box off;
% axis square;
axis off;
set(gcf,'color','w');
重新调用运行即可:
x=-2:0.001:2;
a=-0.5;
w=abs(x);
y=(1.5.*w.^3-2.5.*w.^2+1).*(w<=1)+(-0.5.*w.^3+2.5.*w.^2-4.*w+2).*(w>1&w<=2);
xyplot(x,y);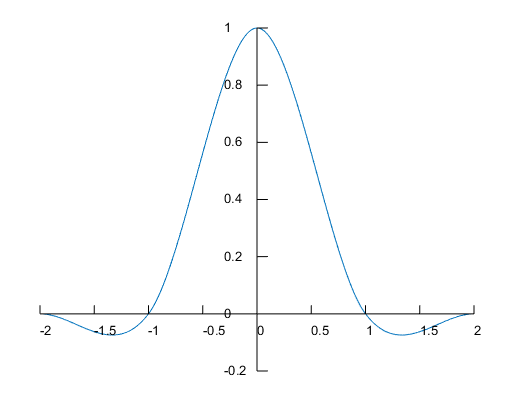


 8810
8810

 被折叠的 条评论
为什么被折叠?
被折叠的 条评论
为什么被折叠?
 到【灌水乐园】发言


