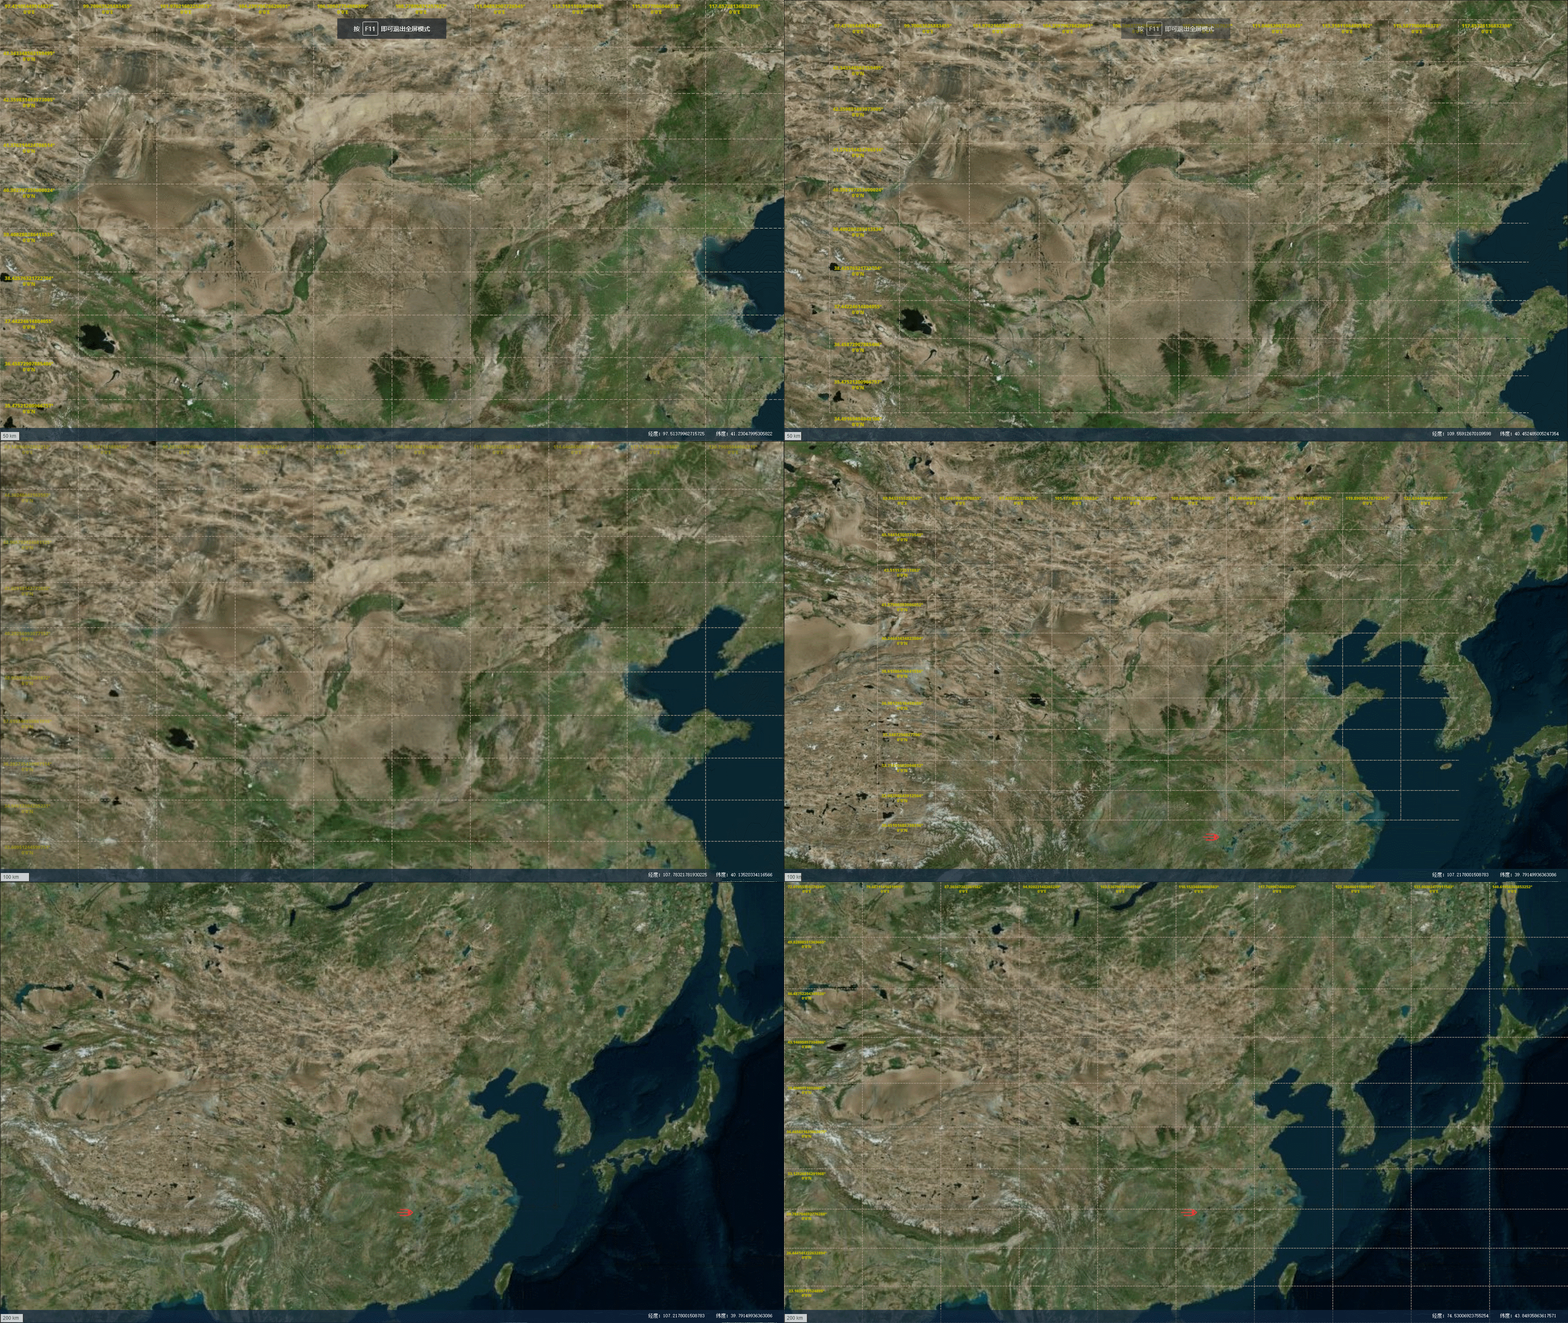
效果图:

实现思路是:
1.获取当前视图的上下左右四个经纬度坐标
2,通过经纬度坐标生成10条经度线,10条纬度线, 这个数量可以根据需求来进行修改
3, 新增geojson文件,并且当图层缩放或者拖拽后重新生成
代码:
   <!--
 * @Author: 老范
 * @Date: 2022-03-16 13:24:33
 * @LastEditors: 老范
 * @LastEditTime: 2022-03-25 15:37:46
 * @Description: 请填写简介
-->

<template>
    <div id="app-map" @dragover="dragover">
        <div style="height: 100%; width: 100%; text-align: left">
            <div ref="mapbox" style="height: 100%; width: 100%">
                <div class="bottom">
                    <div class="calculation-box">
                        <div id="calculated-area"></div>
                    </div>
                    <pre id="coordinates" class="coordinates" style="margin: 0; line-height: 28px">
                      经度:<span id="lng"></span>纬度:<span id="lat"></span>
                    </pre>
                </div>
            </div>
        </div>

    </div>
</template>

<script>
    import gridLayer from '@/utils/gridLayer'
    export default {
        data() {
            return {
                range: 5, //地图缩放等级,
                bounds: { _sw: { lng: -180, lat: -180 }, _ne: { lng: 180, lat: 180 } }, //地图显示边界,
                realData: {},
                style: {
                    line: {
                        "line-dasharray": [2, 2, 2, 2],
                        //设置线颜色
                        "line-color": "#b09e8f",
                        //设置线宽度,像素单位
                        "line-width": 1.5
                    },
                    point: {
                        "text-color": "#c4bb00",
                        "text-halo-width": 2,
                    }
                }
            };
        },
        mounted() {
            this.init();
        },
        methods: {
            //初始化
            init() {
                // 初始化地图
                // refs标签,用于访问代码中的DOM元素 //地图实例自行创建配置
                this.map = this.$utils.createMap(this.$refs.mapbox);
                // 鼠标移动
                this.map.addControl(this.$utils.creatScale());
                let map = this.map;
                let that = this;
                map.on("load", function () {
                    that.loadGrid()
                    layerAdd(map);
                });
                // 地图右下角坐标
                map.on("mousemove", function (e) {
                    if (e.lngLat.lng < -180) e.lngLat.lng += 360;
                    if (e.lngLat.lng > 180) e.lngLat.lng -= 360;
                    let lng = document.getElementById("lng");
                    lng.innerHTML = e.lngLat.lng;
                    let lat = document.getElementById("lat");
                    lat.innerHTML = e.lngLat.lat;
                });
                map.on('moveend', function (e) {
                    gridLayer.initStyle(that.style)
                    gridLayer.initProperty(that.map);
                    gridLayer.initGrid();
                });
                map.on('zoomend', function (e) {
                    gridLayer.initStyle(that.style)
                    gridLayer.initProperty(that.map);
                    gridLayer.initGrid();
                });
            },
            loadGrid() {
                gridLayer.initStyle(this.style)
                gridLayer.initProperty(this.map);
                gridLayer.addSourceData([]);
                gridLayer.addLayerData()
                gridLayer.initGrid();
            },
            // 拖拽触发时调用
            dragover(event) {
                event.preventDefault();
                event.dataTransfer.dropEffect = "move";
            }
        }
    };
</script>

<style scoped>
    #app-map {
        width: 100vw;
        height: 100vh;
    }

    /*底部*/
    .bottom {
        width: 100%;
        height: 3%;
        min-height: 20px;
        background: rgba(16, 37, 63, 0.7);
        position: absolute;
        bottom: 0;
        display: flex;
        justify-content: space-between;
        color: #ffffff;
    }
</style>
核心layer代码:
gridLayer.js
/*
 * @Author: 老范
 * @Date: 2022-03-24 16:13:39
 * @LastEditors: 老范
 * @LastEditTime: 2022-03-25 13:46:46
 * @Description: 请填写简介
 */
const gridLayer = {
    map: null,
    bounds: null,//当前地图的四个顶点
    style: null,
    initStyle(style) {
        this.style = style;
    },
    addSourceData(Lines, Points) {
        if (this.map.getSource('gridLine') || this.map.getSource('gridPoint')) {
            if (this.map.getLayer('Linegrid') || this.map.getLayer('Pointgrid')) {
                this.map.removeLayer("Linegrid");
                this.map.removeLayer("Pointgrid");
            }
            this.map.removeSource("gridLine");
            this.map.removeSource("gridPoint");
            this.map.addSource('gridLine', {
                'type': 'geojson',
                'data': {
                    'type': 'FeatureCollection',
                    'features': Lines
                }
            });
            this.map.addSource('gridPoint', {
                'type': 'geojson',
                'data': {
                    'type': 'FeatureCollection',
                    'features': Points
                }
            });
            this.addLayerData();
        } else {
            this.map.addSource('gridLine', {
                'type': 'geojson',
                'data': {
                    'type': 'FeatureCollection',
                    'features': []
                }
            });
            this.map.addSource('gridPoint', {
                'type': 'geojson',
                'data': {
                    'type': 'FeatureCollection',
                    'features': []
                }
            });
        }
    },
    addLayerData(style) {
        //将线添加到一个图层中,在地图中显示
        this.map.addLayer({
            //此id可随意设置,但是要唯一
            "id": "Linegrid",
            //指定类型为线
            "type": "line",
            //设置数据来源
            "source": 'gridLine',
            //设置线型
            "layout": {
                //线条末端样式
                'line-cap': 'round',
                //线条相交处样式
                'line-join': 'round'
            },
            //设置绘制参数
            "paint": this.style.line
        });
        this.map.addLayer({
            "id": "Pointgrid",
            "type": "symbol",
            "source": "gridPoint",
            'layout': {
                'text-field': ['get', 'name'],
                'text-font': [
                    'NotoSans-Black'
                ],
                'text-offset': [6, 3],
                'text-anchor': 'bottom',
                "text-size": [
                    "interpolate",
                    ["linear"],
                    ["zoom"],
                    4, 9,
                    6, 12
                ],
            },
            "paint": this.style.point
        })
    },
    initProperty: function (map) {//初始化当前地图的状态
        this.map = map;
        // this.level = this.map.getZoom();
        // this.initCenter = map.getCenter();
        this.bounds = {
            x1: this.map.getBounds().getSouthWest().lng,
            y1: this.map.getBounds().getSouthWest().lat,
            x2: this.map.getBounds().getNorthEast().lng,
            y2: this.map.getBounds().getNorthEast().lat,
        };
    },
    initGrid: function () {//初始化网格
        //获取当前网格跨度
        //初始化地图上的网格
        let points = [];
        let geometryLine = [];
        let geometryPoint = [];
        let betweenX = (this.bounds.x2 - this.bounds.x1) / 10 //差额十等分,需要几等分更改即可
        let betweenY = (this.bounds.y2 - this.bounds.y1) / 10
        this.XY = this.bounds;
        for (var i = this.XY.x1; i < this.XY.x2; i = i + betweenX) {
            points = [];
            points.push([i, this.XY.y1], [i, this.XY.y2]);
            geometryLine.push({
                "type": "Feature",
                "geometry": {
                    "type": "LineString",
                    "coordinates": points
                }
            });
            geometryPoint.push({
                "type": "Feature",
                "geometry": {
                    "type": "Point",
                    "coordinates": points[1]
                },
                'properties': {
                    'name': "" + i + "° 0'0'E"
                }
            });
        }
        for (var i = this.XY.y1; i < this.XY.y2; i = i + betweenY) {
            points = [];
            points.push([this.XY.x1, i], [this.XY.x2, i])
            geometryLine.push({
                "type": "Feature",
                "geometry": {
                    "type": "LineString",
                    "coordinates": points
                }
            });
            geometryPoint.push({
                "type": "Feature",
                "geometry": {
                    "type": "Point",
                    "coordinates": points[0]
                },
                'properties': {
                    'name': "" + i + "° 0'0'N"
                }
            });
        }
        this.addSourceData(geometryLine, geometryPoint);
    }
}
export default gridLayer


 1万+
1万+

 被折叠的 条评论
为什么被折叠?


