


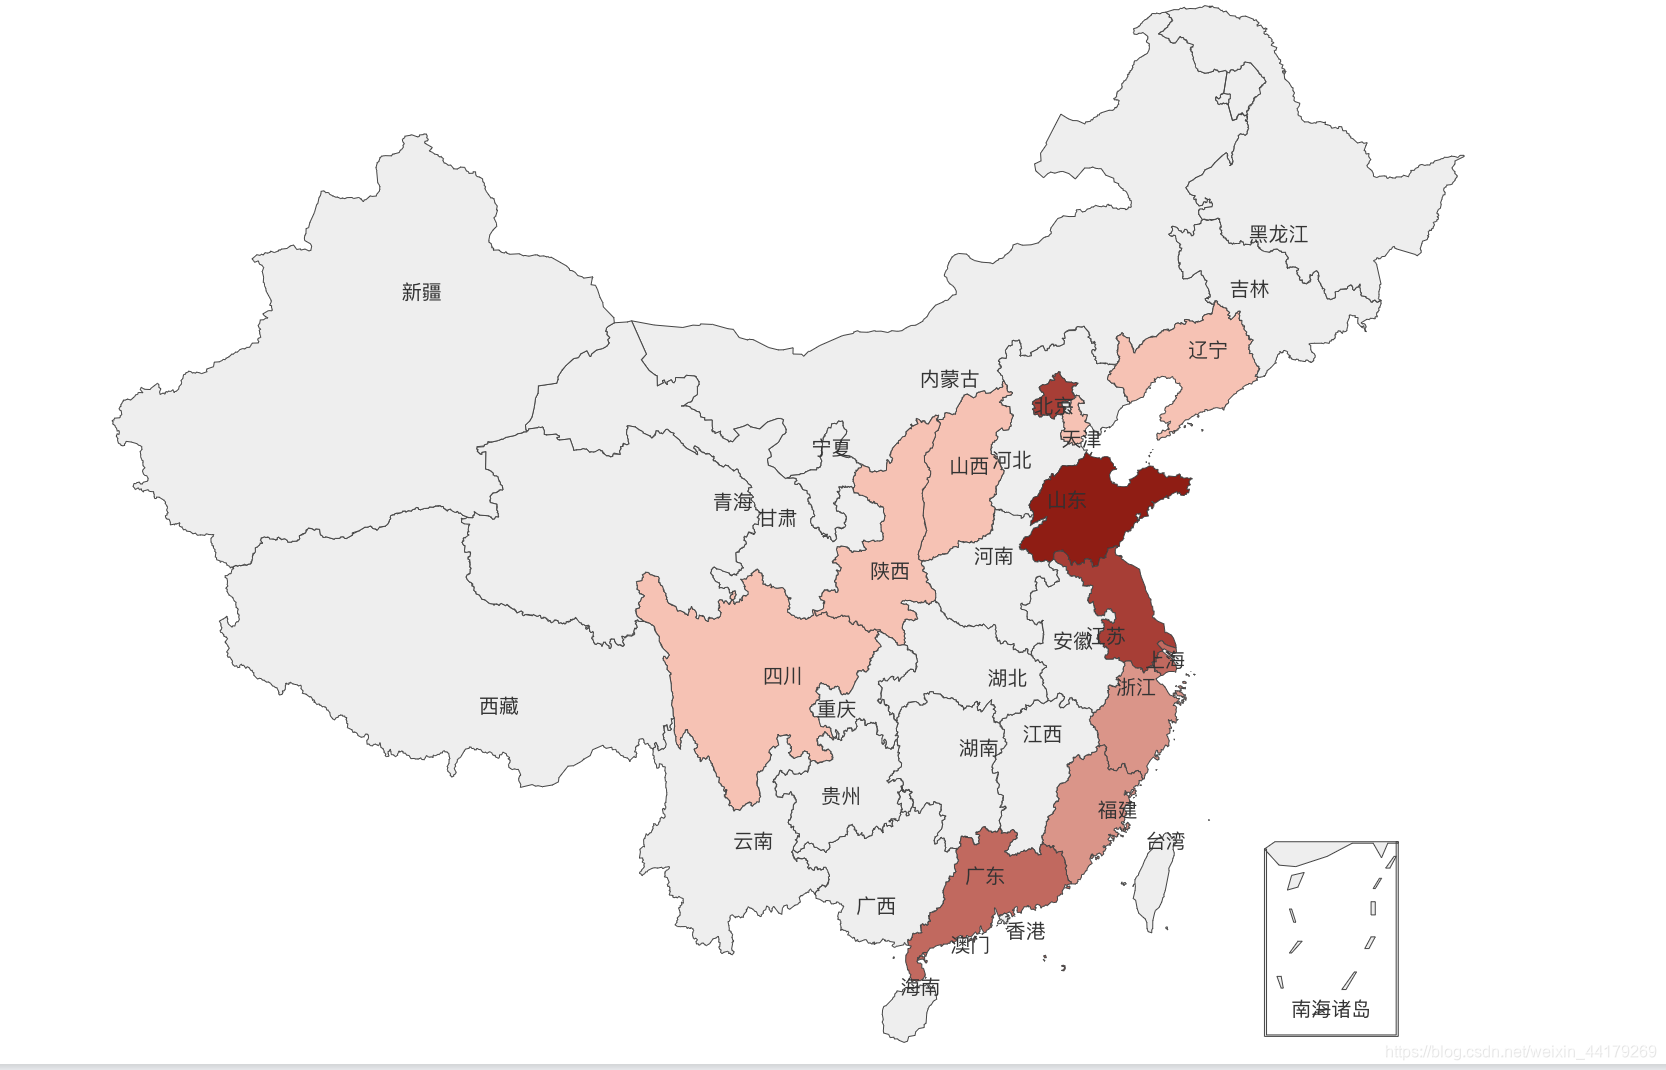
最终呈现效果:
<template>
  <!-- 初始化echarts需要个 有宽高的 盒子 -->
  <div ref="mapbox" style="height: 540px; width: 900px"></div>
</template>


<script>
import { getMap } from "../api/mainApi";
const option = {
  // ----------   series:地图数据可视化,添加data数据    ---------------------

  series: [
    {
      name: "毕业去向",
      type: "map", // 告诉echarts 要去渲染的是一个地图
      map: "china", // 告诉echarts 要去渲染中国地图
      label: {
        // 控制对应地区的汉字
        show: true,
        color: "#333", // 控制地区名的字体颜色---黑色,省名字
        fontSize: 10,
      },
      itemStyle: {
        // 地图板块的颜色和边框---灰色,各个省界线
        areaColor: "#eee",
        // borderColor:'blue'
      },
      roam: true,
      zoom: 1.2, // 控制地图的放大和缩小
      emphasis: {
        // 控制鼠标滑过之后的背景色和字体颜色--白色
        label: {
          color: "#fff",
          fontSize: 12,
        },
        itemStyle: {
          areaColor: "#83b5e7", //  滑动到哪个地区就显示蓝色
        },
      },
      data: [], // 用来展示后台给的数据的 {name:xx,value:xxx}
    },
  ],

  //-----------    visualMap:视觉映射,每个颜色代表什么含义   -----------------------------
  visualMap: [
    {
      type: "piecewise",
      show: true,
      // splitNumber:4
      pieces: [
        // 分段
        { min: 201 },
        { min: 121, max: 200 },
        { min: 51, max: 120 },
        { min: 10, max: 50 },
        { min: 1, max: 9 },
      ],
      inRange: {
        symbol: "rect",
        color: ["#ffc0b1", "#9c0505"], //   浅红~~深红色
      },
      itemWidth: 20,
      itemHeight: 10,
    },
  ],

  //-------------------------------------------------------------------
  tooltip: {
    trigger: "item",
  },
  toolbox: {
    show: true,
    orient: "vertical",
    left: "right",
    top: "center",
    feature: {
      saveAsImage: {},
    },
  },
};

export default {
  name: "ChinaMap",
  mounted() {
    this.getData();
    this.mychart = this.$echarts.init(this.$refs.mapbox);
    this.mychart.setOption(option);
  },
  computed: {
    myChart() {
      return this.$echarts.init(this.$refs.mapbox);
    },
  },
  methods: {
    getData() {
      getMap(2017, 2020, (res) => {
        let list = res;
        console.log(list);
        option.series[0].data = list;
        this.mychart.setOption(option);
      });

      // 这行代码能执行的前提是 DOM已经渲染完成,只有DOM渲染完成才能够执行 echarts初始化
      // }
      // })
    },
    resize() {
      this.myChart.resize();
    },
  },
};
</script>
<!-- Add "scoped" attribute to limit CSS to this component only -->
<style scoped>
h3 {
  margin: 40px 0 0;
}
ul {
  list-style-type: none;
  padding: 0;
}
li {
  display: inline-block;
  margin: 0 10px;
}
a {
  color: #42b983;
}
</style>


 694
694


 被折叠的 条评论
为什么被折叠?
被折叠的 条评论
为什么被折叠?
 到【灌水乐园】发言


