


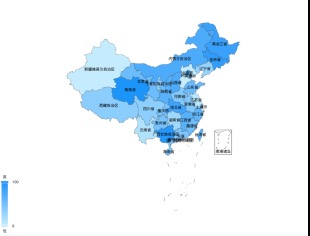
要在 React Native 中实现一个中国地区分布图
使用 WebView + ECharts 实现
效果实现图:
import React from 'react';
import {View} from 'react-native';
import {WebView} from 'react-native-webview';
/**
 *
 * 中国分布地图组件
 * 效果图地址:https://oss.leixiaoan.com/lxz-icon/home/chinaMap.jpg
 */
const ChinaMap = () => {
  const html = `
    <!DOCTYPE html>
    <html>
      <head>
        <meta charset="UTF-8" />
        <script src="https://cdn.jsdelivr.net/npm/echarts@5/dist/echarts.min.js"></script>
        <style>
          html, body, #main {
            height: 100%;
            margin: 0;
            padding: 0;
          }
        </style>
      </head>
      <body>
        <div id="main"></div>
        <script>
          // 动态加载中国地图 GeoJSON 数据
          fetch('https://geo.datav.aliyun.com/areas/bound/100000_full.json')
            .then(res => res.json())
            .then(geoJson => {
              echarts.registerMap('china', geoJson);
              var chart = echarts.init(document.getElementById('main'));
              var option = {
                tooltip: {
                  trigger: 'item',
                  formatter: '{b}: {c}'
                },
                visualMap: {
                  min: 0,
                  max: 100,
                  left: 'left',
                  top: 'bottom',
                  text: ['高', '低'],
                  calculable: true,
                  inRange: {
                    color: ['#d0f0ff', '#409EFF'] // 从浅到深的蓝色
                  },
                  outOfRange: {
                    color: '#e6f7ff'  // 空值背景色(浅蓝)
                  }
                },
                series: [{
                  name: '地区数值',
                  type: 'map',
                  map: 'china',
                  label: {
                    show: true
                  },
                  data: [
                    { name: '北京市', value: Math.floor(Math.random() * 101) },
                    { name: '天津市', value: Math.floor(Math.random() * 101) },
                    { name: '上海市', value: Math.floor(Math.random() * 101) },
                    { name: '重庆市', value: Math.floor(Math.random() * 101) },

                    { name: '河北省', value: Math.floor(Math.random() * 101) },
                    { name: '山西省', value: Math.floor(Math.random() * 101) },
                    { name: '辽宁省', value: Math.floor(Math.random() * 101) },
                    { name: '吉林省', value: Math.floor(Math.random() * 101) },
                    { name: '黑龙江省', value: Math.floor(Math.random() * 101) },
                    { name: '江苏省', value: Math.floor(Math.random() * 101) },
                    { name: '浙江省', value: Math.floor(Math.random() * 101) },
                    { name: '安徽省', value: Math.floor(Math.random() * 101) },
                    { name: '福建省', value: Math.floor(Math.random() * 101) },
                    { name: '江西省', value: Math.floor(Math.random() * 101) },
                    { name: '山东省', value: Math.floor(Math.random() * 101) },
                    { name: '河南省', value: Math.floor(Math.random() * 101) },
                    { name: '湖北省', value: Math.floor(Math.random() * 101) },
                    { name: '湖南省', value: Math.floor(Math.random() * 101) },
                    { name: '广东省', value: Math.floor(Math.random() * 101) },
                    { name: '海南省', value: Math.floor(Math.random() * 101) },
                    { name: '四川省', value: Math.floor(Math.random() * 101) },
                    { name: '贵州省', value: Math.floor(Math.random() * 101) },
                    { name: '云南省', value: Math.floor(Math.random() * 101) },
                    { name: '陕西省', value: Math.floor(Math.random() * 101) },
                    { name: '甘肃省', value: Math.floor(Math.random() * 101) },
                    { name: '青海省', value: Math.floor(Math.random() * 101) },
                    { name: '台湾省', value: Math.floor(Math.random() * 101) },

                    { name: '内蒙古自治区', value: Math.floor(Math.random() * 101) },
                    { name: '广西壮族自治区', value: Math.floor(Math.random() * 101) },
                    { name: '西藏自治区', value: Math.floor(Math.random() * 101) },
                    { name: '宁夏回族自治区', value: Math.floor(Math.random() * 101) },
                    { name: '新疆维吾尔自治区', value: Math.floor(Math.random() * 101) },

                    { name: '香港特别行政区', value: Math.floor(Math.random() * 101) },
                    { name: '澳门特别行政区', value: Math.floor(Math.random() * 101) },
                  ]
                }]
              };
              chart.setOption(option);
            });
        </script>
      </body>
    </html>
    `;

  return (
    <View style={{flex: 1, backgroundColor: 'red', width: '100%', height: 300}}>
      <WebView originWhitelist={['*']} source={{html}} />
    </View>
  );
};

export default ChinaMap;


 被折叠的 条评论
为什么被折叠?
被折叠的 条评论
为什么被折叠?
 到【灌水乐园】发言


