


 <template>
<div class="containers" id="containers" ref="containers">
<div ref="mychart" class="echart" id="mychart" :style="myChartStyle" ></div>
</div>
</template>
data() {
return {
isActivated: false,//判断资源加载
myChart:null,
contract_fee_htqd:null,
crane_num_htqd:null,
myChartStyle: { float: "left", width: "100%", height: "550px",margin: "0 0px 0 0" }, //图表样式
}
},
activated() {
if(!this.isActivated){//判断资源加载次数,只加载一次
this.isActivated = true
this.topLeft()
window.addEventListener("resize", () => { this.handleResize()}) //监听图表,自适应
}
window.dispatchEvent(new Event('resize')) // 向windows发送自定义事件的触发自适应
},
beforeDestroy() {
window.removeEventListener('resize', this.handleResize());
},
methods: {
handleResize(){
//获取初始化图表名称
this.myChart = echarts.init(this.$refs.mychart);
//自适应图表
this.myChart.resize();
},
topLeft() {
selectTHQD().then(res =>{
const result =res.result
for(var i=0; i< result.length;i++){
this.month_htqd.push(result[i].month);
this.contract_fee_htqd.push(result[i].contract_fee);
this.crane_num_htqd.push(result[i].crane_num)
}
const option = {
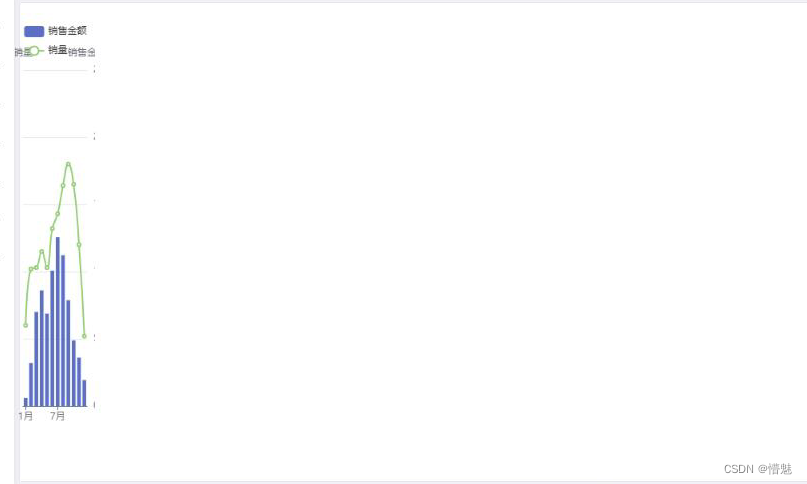
title: {
text: '近一年销量/销售额状况'
},
tooltip: {
trigger: 'axis',
axisPointer: { type: 'cross' }
},
legend: {},
xAxis: [
{
type: 'category',
axisTick: {
alignWithLabel: true
},
data: this.month_htqd,
name: '月份',
}
],
yAxis: [
{
type: 'value',
name: '销售金额',
min: 0,
//max: 250,
position: 'right',
axisLabel: {
formatter: '{value} '
}
},
{
type: 'value',
name: '销量',
min: 0,
//max: 25,
position: 'left',
axisLabel: {
formatter: '{value} '
}
}
],
series: [
{
name: '销售金额',
type: 'bar',
yAxisIndex: 0,
data: this.contract_fee_htqd
},
{
name: '销量',
type: 'line',
smooth: true,
yAxisIndex: 1,
data: this.crane_num_htqd
}
]
};
const myChart = echarts.init(document.getElementById("mychart"));
myChart.setOption(option);
})
},
}


 被折叠的 条评论
为什么被折叠?
被折叠的 条评论
为什么被折叠?
 到【灌水乐园】发言


