


 该博客展示了如何利用Python处理波面数据,计算平均波高、有效波高以及平均周期。通过对波面数据的分析,找到波峰和波谷的间隔,进而求得波高和周期。最终,还绘制了波高和周期的概率分布图,以直观展示数据分布情况。
通过python计算有效波高,平均波高,平均周期,有效周期
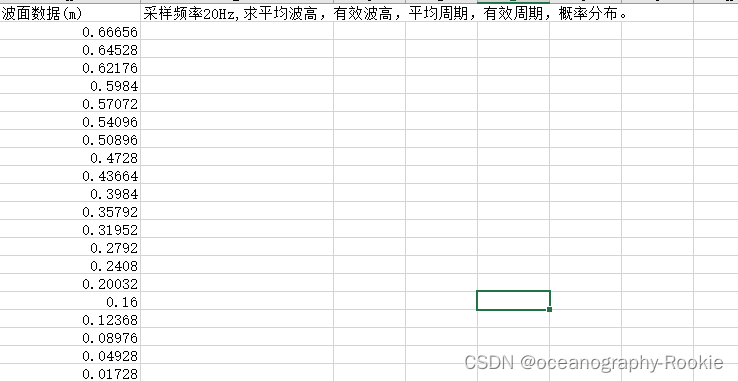
现有波面数据如下图所示,采用频率为20Hz,需要根据波面数据计算得到平均波高、有效波高等信息。
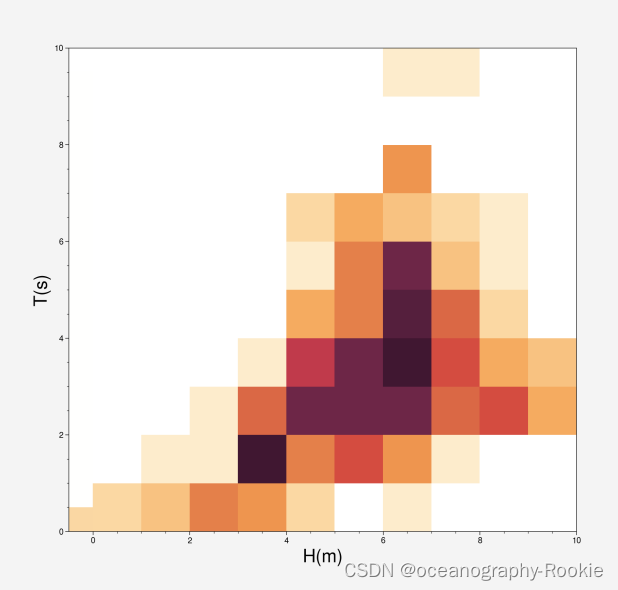
python代码如下所示,绘图部分仅展示了概率分布:
# -*- coding: utf-8 -*-
"""
Created on %(date)s

@author: %(jixianpu)s

Email : 211311040008@hhu.edu.cn

introduction : keep learning althongh walk slowly
"""

import matplotlib.pyplot as plt
import pandas as pd

import numpy as np
path=r'D:/data.xlsx'

data=pd.read_excel(path)

high=data['波面数据(m)']

da=np.array(high)

da=da
a=[]
for i in range(len(da)-1):
    if (da[i]<0)&(da[i+1]>0):
        print(i)
        a.append(i)
wh=[]
tm=[]
for j in range(len(a)-1):

    x=da[a[j]:a[j+1]]

    x_max=np.max(x)
    x_min=np.min(x)

    h=x_max-x_min

    t=a[j+1]-a[j]

    tr=0.05*t
    tm.append(tr)
    wh.append(h)


### mean time \mean wave high
h_mean=np.mean(wh)
t_mean=np.mean(tm)


###
h_s=sorted(wh,reverse=True)
hs_3=h_s[0:int(len(h_s)/3)+1]
hs3_mean=np.mean((hs_3))

t_s=sorted(tm,reverse=True)
ts_3=t_s[0:int(len(h_s)/3)+1]
ts3_mean=np.mean(ts_3)


####f
hist, x, y= np.histogram2d(wh,tm,bins=10)
############################################################################
fig=plt.figure(figsize=(10,10))
ax = fig.add_subplot(111)

# ax.plot(da[0:1000])

# plt.axhline(y=0, color='r', linestyle='--')
ax.imshow(hist)
ax.set_xlabel('H(m)',fontsize=20)
ax.set_ylabel('T(s)',fontsize=20)
ax.set_ylim(0,10)
ax.pcolor(hist)
# ax.bar(x,y)
plt.show()


 4936
4936

 被折叠的 条评论
为什么被折叠?
被折叠的 条评论
为什么被折叠?
 到【灌水乐园】发言


