


首先我们需要看下 profiling 是否开启,开启它可以让 MySQL 收集在 SQL 执行时所使用的资源情况,命令如下:
mysql> select @@profiling;
profiling=0 代表关闭,我们需要把 profiling 打开,即设置为 1:
mysql> set profiling=1;查看数据库
MariaDB [(none)]> show databases;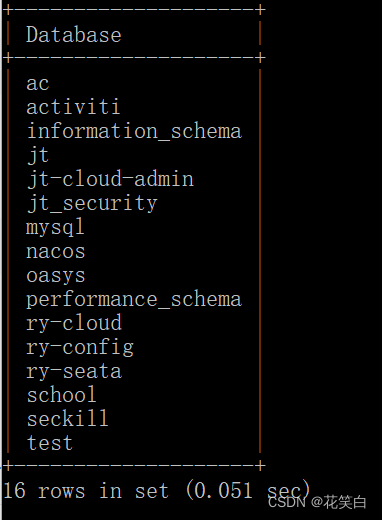
使用数据库
MariaDB [(none)]> use ac查看里面的表
MariaDB [ac]> show tables;
然后我们执行一个 SQL 查询(你可以执行任何一个 SQL 查询):
MariaDB [ac]> select * from ac.demo_user;查看当前会话所产生的所有 profiles:
MariaDB [ac]> show profiles;
如果我们想要获取上一次查询的执行时间,可以使用:
MariaDB [ac]> show profile;
当然你也可以查询指定的 Query ID,比如:
mysql> show profile for query 2;查询 SQL 的执行时间结果和上面是一样的。


 1172
1172


 被折叠的 条评论
为什么被折叠?
被折叠的 条评论
为什么被折叠?
 到【灌水乐园】发言


