


本文适合对JVM GC有一定了解的开发人员, 通过一段代码来看看GC回收过程
-Xms41m -Xmx41m -Xmn10m -XX:+UseParallelGC -XX:+PrintGCDetails
代码:
public class JvmGcTest {
/**
* 最小的单位
*/
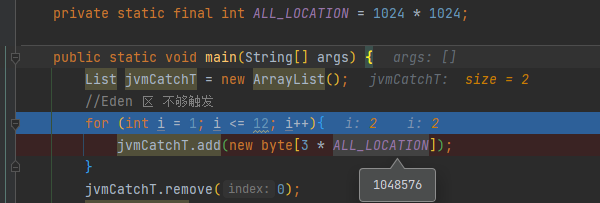
private static final int ALL_LOCATION = 1024 * 1024;
public static void main(String[] args) {
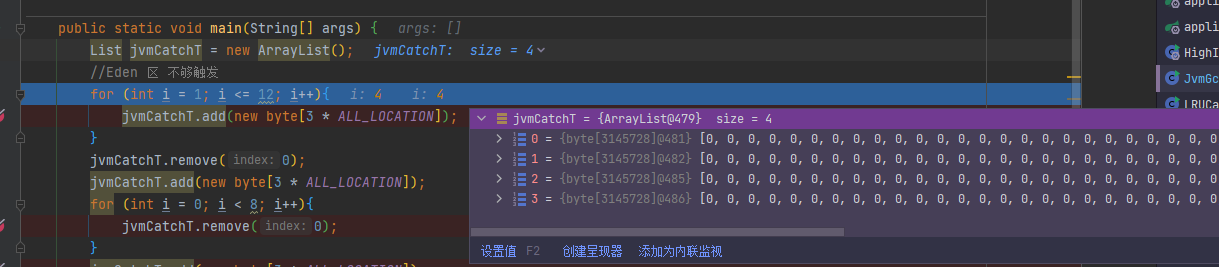
List jvmCatchT = new ArrayList();
//Eden 区 不够触发
for (int i = 1; i <= 12; i++){
jvmCatchT.add(new byte[3 * ALL_LOCATION]);
}
jvmCatchT.remove(0);
jvmCatchT.add(new byte[3 * ALL_LOCATION]);
for (int i = 0; i < 8; i++){
jvmCatchT.remove(0);
}
jvmCatchT.add(new byte[3 * ALL_LOCATION]);
for (int i = 0; i < 6; i++){
jvmCatchT.add(new byte[3 * ALL_LOCATION]);
}
}
}
日志结构解释:
并发回收(UseParallelGC)日志结构
[GC (Allocation Failure) [PSYoungGen: 5428K->792K(9216K)] 5428K->3872K(41984K), 0.0021532 secs] [Times: user=0.00 sys=0.00, real=0.00 secs]
该日志由以下几个部分组成:
[GC (Allocation Failure)]:表示进行的垃圾收集的类型,这里是"Allocation Failure"。这意味着垃圾收集器触发了一次收集操作,因为在尝试为新的对象分配内存时出现了内存分配失败的情况。
[PSYoungGen: 5428K->792K(9216K)]:表示年轻代(Young Generation)的信息。Young Generation是JVM堆内存的一部分,用于存放新创建的对象。该部分的结构是[年轻代区域: 收集前内存使用量->收集后内存使用量(总内存大小)]。在这个例子中,年轻代区域为PSYoungGen,收集前内存使用量为5428K,收集后内存使用量为792K,总内存大小为9216K。
5428K->3872K(41984K):表示整个堆内存的信息。这部分的结构是收集前堆内存使用量->收集后堆内存使用量(总堆内存大小)。在这个例子中,收集前堆内存使用量为5428K,收集后堆内存使用量为3872K,总堆内存大小为41984K。
0.0021532 secs:表示垃圾收集过程的持续时间,以秒为单位。
[Times: user=0.00 sys=0.00, real=0.00 secs]:提供了与垃圾收集相关的时间信息。其中"user"表示用户态时间,"sys"表示系统态时间,"real"表示实际经过的时间
G1回收器日志结构
[GC pause (G1 Humongous Allocation) (young) (initial-mark), 0.0092573 secs]
[Parallel Time: 1.3 ms, GC Workers: 4]
[GC Worker Start (ms): Min: 4519.3, Avg: 4519.5, Max: 4519.7, Diff: 0.4]
[Ext Root Scanning (ms): Min: 0.0, Avg: 0.4, Max: 1.0, Diff: 1.0, Sum: 1.6]
[Update RS (ms): Min: 0.0, Avg: 0.0, Max: 0.0, Diff: 0.0, Sum: 0.0]
[Processed Buffers: Min: 0, Avg: 0.0, Max: 0, Diff: 0, Sum: 0]
[Scan RS (ms): Min: 0.0, Avg: 0.0, Max: 0.0, Diff: 0.0, Sum: 0.0]
[Code Root Scanning (ms): Min: 0.0, Avg: 0.0, Max: 0.0, Diff: 0.0, Sum: 0.0]
[Object Copy (ms): Min: 0.1, Avg: 0.6, Max: 0.9, Diff: 0.8, Sum: 2.2]
[Termination (ms): Min: 0.0, Avg: 0.1, Max: 0.2, Diff: 0.2, Sum: 0.6]
[Termination Attempts: Min: 1, Avg: 2.0, Max: 5, Diff: 4, Sum: 8]
[GC Worker Other (ms): Min: 0.0, Avg: 0.0, Max: 0.1, Diff: 0.0, Sum: 0.1]
[GC Worker Total (ms): Min: 0.9, Avg: 1.1, Max: 1.3, Diff: 0.4, Sum: 4.5]
[GC Worker End (ms): Min: 4520.6, Avg: 4520.6, Max: 4520.6, Diff: 0.0]
[Code Root Fixup: 0.0 ms]
[Code Root Purge: 0.0 ms]
[Clear CT: 0.1 ms]
[Other: 7.9 ms]
[Choose CSet: 0.0 ms]
[Ref Proc: 7.7 ms]
[Ref Enq: 0.0 ms]
[Redirty Cards: 0.1 ms]
[Humongous Register: 0.0 ms]
[Humongous Reclaim: 0.0 ms]
[Free CSet: 0.0 ms]
[Eden: 3072.0K(10.0M)->0.0B(9216.0K) Survivors: 0.0B->1024.0K Heap: 14.2M(42.0M)->12.8M(42.0M)]
[Times: user=0.05 sys=0.00, real=0.01 secs]
[GC concurrent-root-region-scan-start]
[GC concurrent-root-region-scan-end, 0.0005350 secs]
[GC concurrent-mark-start]
[GC concurrent-mark-end, 0.0000242 secs]
[GC remark [Finalize Marking, 0.0002246 secs] [GC ref-proc, 0.0002160 secs] [Unloading, 0.0004070 secs], 0.0009601 secs]
[Times: user=0.00 sys=0.00, real=0.00 secs]
[GC cleanup 15M->15M(42M), 0.0006222 secs]
[Times: user=0.00 sys=0.00, real=0.00 secs]
[GC pause (G1 Humongous Allocation) (young) (initial-mark), 0.0074065 secs]:这是一次G1垃圾收集暂停的开始,标识为"G1 Humongous Allocation",属于young generation的收集,并包括initial-mark阶段。该垃圾收集过程耗时0.0074065秒。
[Parallel Time: 7.2 ms, GC Workers: 4]:这部分提供了并行垃圾收集的信息。并行时间为7.2毫秒,使用了4个GC线程。
下面是并行垃圾收集期间各阶段的详细信息:
[GC Worker Start (ms): Min: 9784.3, Avg: 9784.4, Max: 9784.6, Diff: 0.3]:各个GC线程开始执行工作的时间。
[Ext Root Scanning (ms): Min: 0.0, Avg: 3.5, Max: 6.8, Diff: 6.8, Sum: 13.8]:扫描外部根对象的时间。
[Update RS (ms): Min: 0.0, Avg: 0.0, Max: 0.0, Diff: 0.0, Sum: 0.0]:更新记忆集的时间。
[Processed Buffers: Min: 0, Avg: 0.0, Max: 0, Diff: 0, Sum: 0]:处理的缓冲区数量。
[Scan RS (ms): Min: 0.0, Avg: 0.0, Max: 0.0, Diff: 0.0, Sum: 0.0]:扫描记忆集的时间。
[Code Root Scanning (ms): Min: 0.0, Avg: 0.0, Max: 0.0, Diff: 0.0, Sum: 0.0]:扫描代码根对象的时间。
[Object Copy (ms): Min: 0.0, Avg: 0.4, Max: 0.9, Diff: 0.8, Sum: 1.8]:对象拷贝的时间。
[Termination (ms): Min: 0.0, Avg: 3.0, Max: 5.9, Diff: 5.9, Sum: 11.8]:终止标记的时间。
[Termination Attempts: Min: 1, Avg: 3.0, Max: 9, Diff: 8, Sum: 12]:终止标记的尝试次数。
[GC Worker Other (ms): Min: 0.0, Avg: 0.0, Max: 0.1, Diff: 0.0, Sum: 0.1]:其他工作线程的时间。
[GC Worker Total (ms): Min: 6.7, Avg: 6.9, Max: 7.0, Diff: 0.4, Sum: 27.6]:工作线程的总时间。
[GC Worker End (ms): Min: 9791.2, Avg: 9791.3, Max: 9791.3, Diff: 0.1]:各个GC线程结束工作的时间。
接下来是一些其他阶段的耗时统计:
[Code Root Fixup: 0.0 ms]:代码根修复的时间。
[Code Root Purge: 0.0 ms]:代码根清除的时间。
[Clear CT: 0.0 ms]:清除卡表的时间。
[Other: 0.2 ms]:其他操作的时间。
[Choose CSet: 0.0 ms]:选择Collection Set的时间。
[Ref Proc: 0.1 ms]:引用处理的时间。
[Redirty Cards: 0.0 ms]:重新标记脏卡的时间。
[Humongous Register: 0.0 ms]:注册巨型对象的时间。
[Humongous Reclaim: 0.0 ms]:回收巨型对象的时间。
[Free CSet: 0.0 ms]:释放Collection Set的时间。
[Eden: 3072.0K(10.0M)->0.0B(9216.0K) Survivors: 0.0B->1024.0K Heap: 14.2M(42.0M)->12.8M(42.0M)]:这是GC过程结束后堆内存的状态信息。Eden区由10.0MB缩小到0.0B,Survivor区由0.0B增加到1024.0KB,堆内存大小从42.0MB缩小到12.8MB。
[Times: user=0.00 sys=0.00, real=0.02 secs]:这是垃圾收集过程的时间统计。
user=0.00:用户态CPU时间。
sys=0.00:系统态CPU时间。
real=0.02 secs:实际经过的时间。
[GC concurrent-root-region-scan-start]:并发扫描根区域的开始。
[GC concurrent-root-region-scan-end, 0.0004935 secs]:并发扫描根区域的结束,耗时0.0004935秒。
[GC concurrent-mark-start]:并发标记过程的开始。
[GC concurrent-mark-end, 0.0000472 secs]:并发标记过程的结束,耗时0.0000472秒。
[GC remark [Finalize Marking, 0.0000770 secs] [GC ref-proc, 0.0001435 secs] [Unloading, 0.0006037 secs], 0.0009193 secs]:垃圾收集的备注阶段,包括完成标记、处理引用和卸载等操作,耗时0.0009193秒。
[GC cleanup 15M->15M(42M), 0.0001038 secs]:垃圾收集的清理阶段,回收了15MB的内存,堆内存大小为42MB,耗时0.0001038秒。
[Times: user=0.00 sys=0.00, real=0.00 secs]:清理阶段的时间统计,与实际经过的时间为0.00秒。
执行日志:
-Xms41m -Xmx41m -Xmn10m
第一次Young GC:
[GC (Allocation Failure) [PSYoungGen: 5428K->792K(9216K)]
5428K->3872K(41984K), 0.0021532 secs] [Times: user=0.00 sys=0.00,
real=0.00 secs]
触发条件:Allocation Failure(分配失败)
PSYoungGen:5428K(回收前大小)-> 792K(回收后大小)(9216K为Young区总大小)
堆内存:5428K(回收前堆内存使用)-> 3872K(回收后堆内存使用)(41984K为堆内存总大小)
耗时:0.0021532秒
第二次Young GC:
[GC (Allocation Failure) [PSYoungGen: 7092K->760K(9216K)]
10172K->9992K(41984K), 0.0022393 secs] [Times: user=0.00 sys=0.00,
real=0.00 secs]
触发条件:Allocation Failure
PSYoungGen:7092K->760K(9216K)
堆内存:10172K->9992K(41984K)
耗时:0.0022393秒
如上面类推,第一个循环之后的GC日志打印
        List jvmCatchT = new ArrayList();
        //Eden 区 不够触发
        for (int i = 1; i <= 12; i++){
            jvmCatchT.add(new byte[3 * ALL_LOCATION]);
        }
[GC (Allocation Failure) [PSYoungGen: 5428K->792K(9216K)] 5428K->3872K(41984K), 0.0021532 secs] [Times: user=0.00 sys=0.00, real=0.00 secs]
[GC (Allocation Failure) [PSYoungGen: 7092K->760K(9216K)] 10172K->9992K(41984K), 0.0022393 secs] [Times: user=0.00 sys=0.00, real=0.00 secs]
[GC (Allocation Failure) [PSYoungGen: 7225K->760K(9216K)] 16457K->16136K(41984K), 0.0023756 secs] [Times: user=0.00 sys=0.00, real=0.00 secs]
[GC (Allocation Failure) [PSYoungGen: 7061K->728K(9216K)] 22437K->22248K(41984K), 0.0073333 secs] [Times: user=0.05 sys=0.00, real=0.01 secs]
[GC (Allocation Failure) [PSYoungGen: 7002K->760K(9216K)] 28522K->28424K(41984K), 0.0017726 secs] [Times: user=0.00 sys=0.00, real=0.00 secs]
[Full GC (Ergonomics) [PSYoungGen: 760K->0K(9216K)] [ParOldGen: 27664K->28332K(32768K)] 28424K->28332K(41984K), [Metaspace: 2934K->2934K(1056768K)], 0.0086626 secs] [Times: user=0.05 sys=0.00, real=0.01 secs]
[Full GC (Ergonomics) [PSYoungGen: 6284K->3072K(9216K)] [ParOldGen: 28332K->31404K(32768K)] 34617K->34476K(41984K), [Metaspace: 2934K->2934K(1056768K)], 0.0066522 secs] [Times: user=0.02 sys=0.00, real=0.01 secs]
后面两个循环
        jvmCatchT.remove(0);
        jvmCatchT.add(new byte[3 * ALL_LOCATION]);
        for (int i = 0; i < 8; i++){
            jvmCatchT.remove(0);
        }
        jvmCatchT.add(new byte[3 * ALL_LOCATION]);
        for (int i = 0; i < 6; i++){
            jvmCatchT.add(new byte[3 * ALL_LOCATION]);
        }
[Full GC (Ergonomics) [PSYoungGen: 6144K->3072K(9216K)] [ParOldGen: 31404K->31404K(32768K)] 37548K->34476K(41984K), [Metaspace: 2934K->2934K(1056768K)], 0.0061606 secs] [Times: user=0.00 sys=0.00, real=0.01 secs]
[Full GC (Ergonomics) [PSYoungGen: 6144K->0K(9216K)] [ParOldGen: 31404K->12972K(32768K)] 37548K->12972K(41984K), [Metaspace: 2934K->2934K(1056768K)], 0.0077531 secs] [Times: user=0.00 sys=0.00, real=0.01 secs]
[GC (Allocation Failure) [PSYoungGen: 6263K->0K(9216K)] 19236K->19116K(41984K), 0.0020343 secs] [Times: user=0.00 sys=0.00, real=0.00 secs]
[GC (Allocation Failure) [PSYoungGen: 6249K->0K(8704K)] 25366K->25260K(41472K), 0.0011327 secs] [Times: user=0.00 sys=0.00, real=0.00 secs]
[Full GC (Ergonomics) [PSYoungGen: 0K->0K(8704K)] [ParOldGen: 25260K->25260K(32768K)] 25260K->25260K(41472K), [Metaspace: 2934K->2934K(1056768K)], 0.0028279 secs] [Times: user=0.00 sys=0.00, real=0.00 secs]
[GC (Allocation Failure) [PSYoungGen: 6269K->0K(8704K)] 31529K->31404K(41472K), 0.0011044 secs] [Times: user=0.00 sys=0.00, real=0.00 secs]
[Full GC (Ergonomics) [PSYoungGen: 0K->0K(8704K)] [ParOldGen: 31404K->31404K(32768K)] 31404K->31404K(41472K), [Metaspace: 2934K->2934K(1056768K)], 0.0027743 secs] [Times: user=0.00 sys=0.00, real=0.00 secs]
结论:
UseParallelGC
在Full GC事件中,年轻代和老年代的垃圾回收分别进行,年轻代的大小减少,而老年代的大小保持不变。
在Full GC事件中,整个堆的大小减少,说明有一定量的垃圾被回收。
在由于分配失败触发的GC事件中,主要是年轻代的垃圾回收,整个堆的大小减少,但幅度较小。
如果JVM 内存 等比例缩放的话
可以得出一些优化的思路:
考虑调整年轻代和老年代的比例:
在GC日志中,年轻代(PSYoungGen)的总大小为9216K,而老年代(ParOldGen)的总大小为32768K。这表示目前的配置是年轻代占整个堆内存的比例较小。您可以考虑增加年轻代的大小,以便更多的对象能够在年轻代中存活,减少对象进入老年代的频率。这有助于提高垃圾回收的效率和性能。
考虑增加堆内存大小:
根据GC日志中的堆内存使用情况,整个堆(Heap)的总大小为41984K。如果您的应用程序需要处理更大规模的数据或者有更高的并发负载,可以考虑增加堆内存的大小。较大的堆内存可以减少垃圾回收的频率和停顿时间,提高应用程序的性能。
考虑设置其他参数(垃圾回收的触发条件和频率):
可以增加触发Full GC的阈值,以减少Full GC的频率。此外,可以根据内存占用率、对象分配速率等指标来动态调整垃圾回收的触发条件,以达到更好的性能表现。
G1回收器异常:
[Full GC (Allocation Failure) 30M->30M(42M), 0.0027109 secs]
[Eden: 0.0B(10.0M)->0.0B(10.0M) Survivors: 0.0B->0.0B Heap: 30.7M(42.0M)->30.7M(42.0M)], [Metaspace: 2934K->2934K(1056768K)]
[Times: user=0.00 sys=0.00, real=0.00 secs]
[Full GC (Allocation Failure) 30M->30M(42M), 0.0027588 secs]
[Eden: 0.0B(10.0M)->0.0B(10.0M) Survivors: 0.0B->0.0B Heap: 30.7M(42.0M)->30.7M(42.0M)], [Metaspace: 2934K->2934K(1056768K)]
[Times: user=0.00 sys=0.00, real=0.00 secs]
[GC concurrent-mark-abort]
Heap
garbage-first heap total 43008K, used 31405K [0x00000000fd600000, 0x00000000fd700150, 0x0000000100000000)
region size 1024K, 1 young (1024K), 0 survivors (0K)
Metaspace used 2966K, capacity 4486K, committed 4864K, reserved 1056768K
class space used 316K, capacity 386K, committed 512K, reserved 1048576K
Exception in thread “main” java.lang.OutOfMemoryError: Java heap space
at com.apollo.threadinterview.JvmGcTest.main(JvmGcTest.java:30)
第一次Full GC:
[Full GC (Allocation Failure) 30M->30M(42M), 0.0027109 secs]:这是第一次Full GC,由于内存分配失败而触发。在这次GC过程中,堆内存的使用量保持不变,为30MB,堆内存总大小为42MB。这次GC过程耗时0.0027109秒。
[Eden: 0.0B(10.0M)->0.0B(10.0M) Survivors: 0.0B->0.0B Heap: 30.7M(42.0M)->30.7M(42.0M)]:Eden区的内存使用量从10.0MB缩小到0.0B,Survivor区的内存使用量也从0.0B缩小到0.0B。整个堆内存的使用量和总大小保持不变,分别为30.7MB和42.0MB。
[Metaspace: 2934K->2934K(1056768K)]:Metaspace的使用量保持不变,为2934KB,Metaspace的总容量为1056768KB。
第二次Full GC:
[Full GC (Allocation Failure) 30M->30M(42M), 0.0027588 secs]:这是第二次Full GC,同样由于内存分配失败而触发。在这次GC过程中,堆内存的使用量保持不变,为30MB,堆内存总大小为42MB。这次GC过程耗时0.0027588秒。
[Eden: 0.0B(10.0M)->0.0B(10.0M) Survivors: 0.0B->0.0B Heap: 30.7M(42.0M)->30.7M(42.0M)]:Eden区的内存使用量从10.0MB缩小到0.0B,Survivor区的内存使用量也从0.0B缩小到0.0B。整个堆内存的使用量和总大小保持不变,分别为30.7MB和42.0MB。
[Metaspace: 2934K->2934K(1056768K)]:Metaspace的使用量保持不变,为2934KB,Metaspace的总容量为1056768KB。
接下来的日志:
[GC concurrent-mark-abort]:并发标记过程中发生了中止。
Heap garbage-first heap total 43008K, used 31405K [0x00000000fd600000, 0x00000000fd700150, 0x0000000100000000):堆内存的总大小为43008KB,已使用的大小为31405KB。
region size 1024K, 1 young (1024K), 0 survivors (0K):堆内存被分成了大小为1024KB的区域,其中有1个young区域,大小为1024KB,没有survivor区域。
Metaspace used 2966K, capacity 4486K, committed 4864K, reserved 1056768K:Metaspace的使用量为2966KB,容量为4486KB,已分配的大小为4864KB,保留的大小为1056768KB。
class space used 316K, capacity 386K, committed 512K, reserved 1048576K:类空间的使用量为316KB,容量为386KB,已分配的大小为512KB,保留的大小为1048576KB。
最后的异常信息:
Exception in thread “main” java.lang.OutOfMemoryError: Java heap space:在主线程中发生了Java堆空间不足的异常,意味着无法再分配足够的内存。
异常的发生-还是跟G1相对复杂的运行原理有关系,相比CMS等老一点的垃圾收集器,G1需要花费大概30%的内存去维护G1低延迟的回收操作,比如Region区域的维护,垃圾碎片扫描等


 669
669


 被折叠的 条评论
为什么被折叠?
被折叠的 条评论
为什么被折叠?
 到【灌水乐园】发言


