


 本文回顾了线性回归中的R²指标,解释其在评估模型拟合度的作用,并通过实例展示了如何使用scipy的pearsonr计算变量间的相关系数。内容涵盖了相关系数的概念、计算方法及其实用场景。
很多统计的概念忘掉了,在这里记录一下。
线性回归R^2
对于 sklearn中的各个线性回归类 ,其中的 score()方法 就是计算R^2来对拟合效果进行 评分 的。
# pearsonr
x = np.random.normal(0, 1, 500)
y_low_noise = x + np.random.normal(0, 1, 500)
y_high_noise = x + np.random.normal(0, 10, 500)

print('low noise:', stats.pearsonr(x, y_low_noise))
print('high noise:', stats.pearsonr(x, y_high_noise))
# 从结果发现,低噪声的两个变量具有强线性相关性;高噪声的两个变量无线性相关性。
# 下面画图感受下
plt.figure(figsize=(8, 4))
plt.subplot(1, 2, 1)
plt.scatter(x, y_low_noise, s=7)
plt.xlabel('x'), plt.ylabel('y_low_noise')
plt.subplot(1, 2, 2)
plt.scatter(x, y_high_noise, s=7, c='r')
plt.xlabel('x'), plt.ylabel('y_high_noise')
plt.tight_layout()
plt.show()
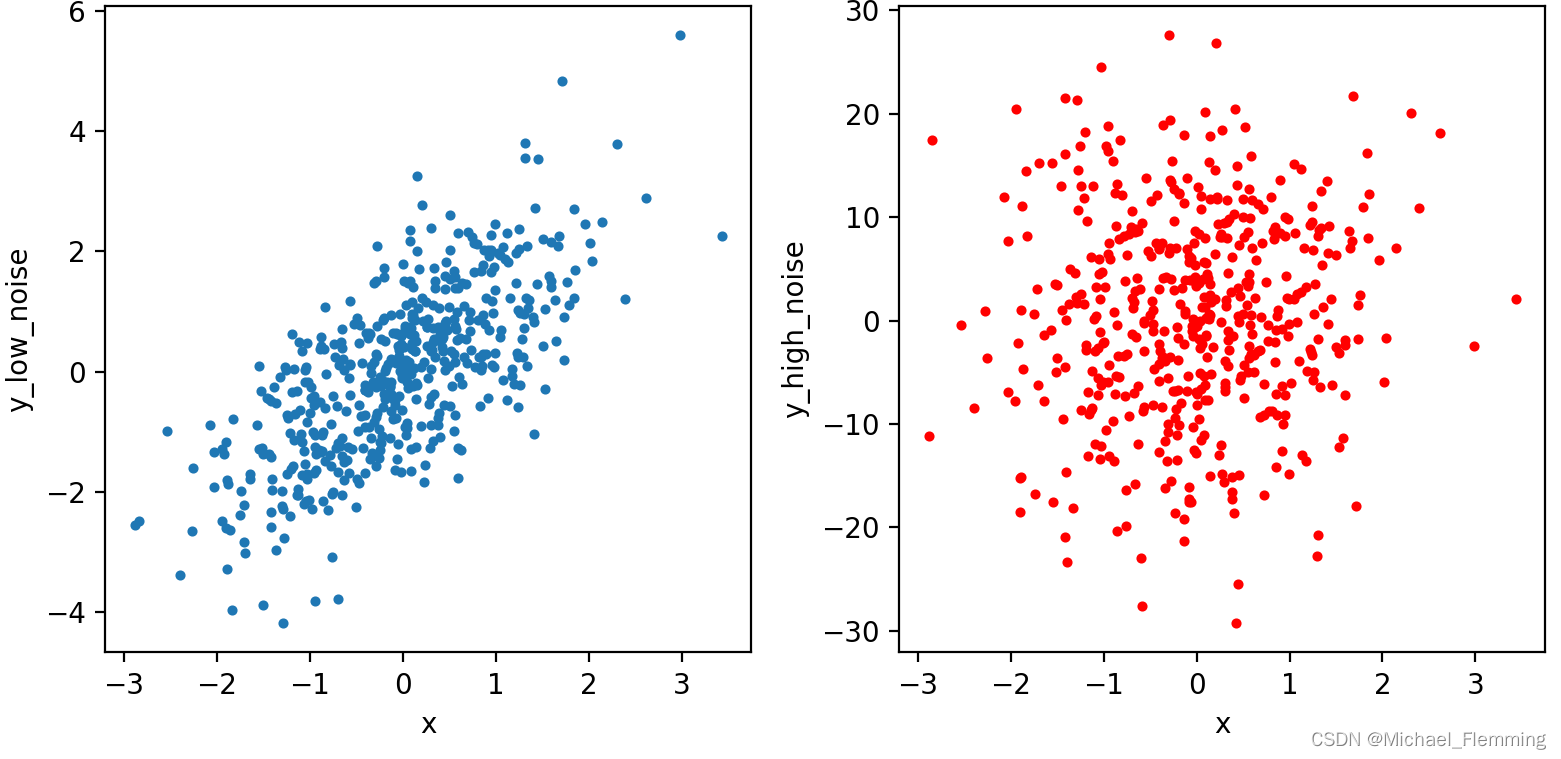
low noise: (0.6974075104800842, 4.561734311417325e-74)
high noise: (0.06881746167941208, 0.12434815182317167)
相关系数
学习链接(讲了)拟合优度 和 相关系数 没有关系:link
scipy中的stats库中的pearsonr函数计算两个变量之间的pearson相关系数 和 p值。
输入(x,y),输出(pearsonr , p-value)


 被折叠的 条评论
为什么被折叠?
被折叠的 条评论
为什么被折叠?
 到【灌水乐园】发言


